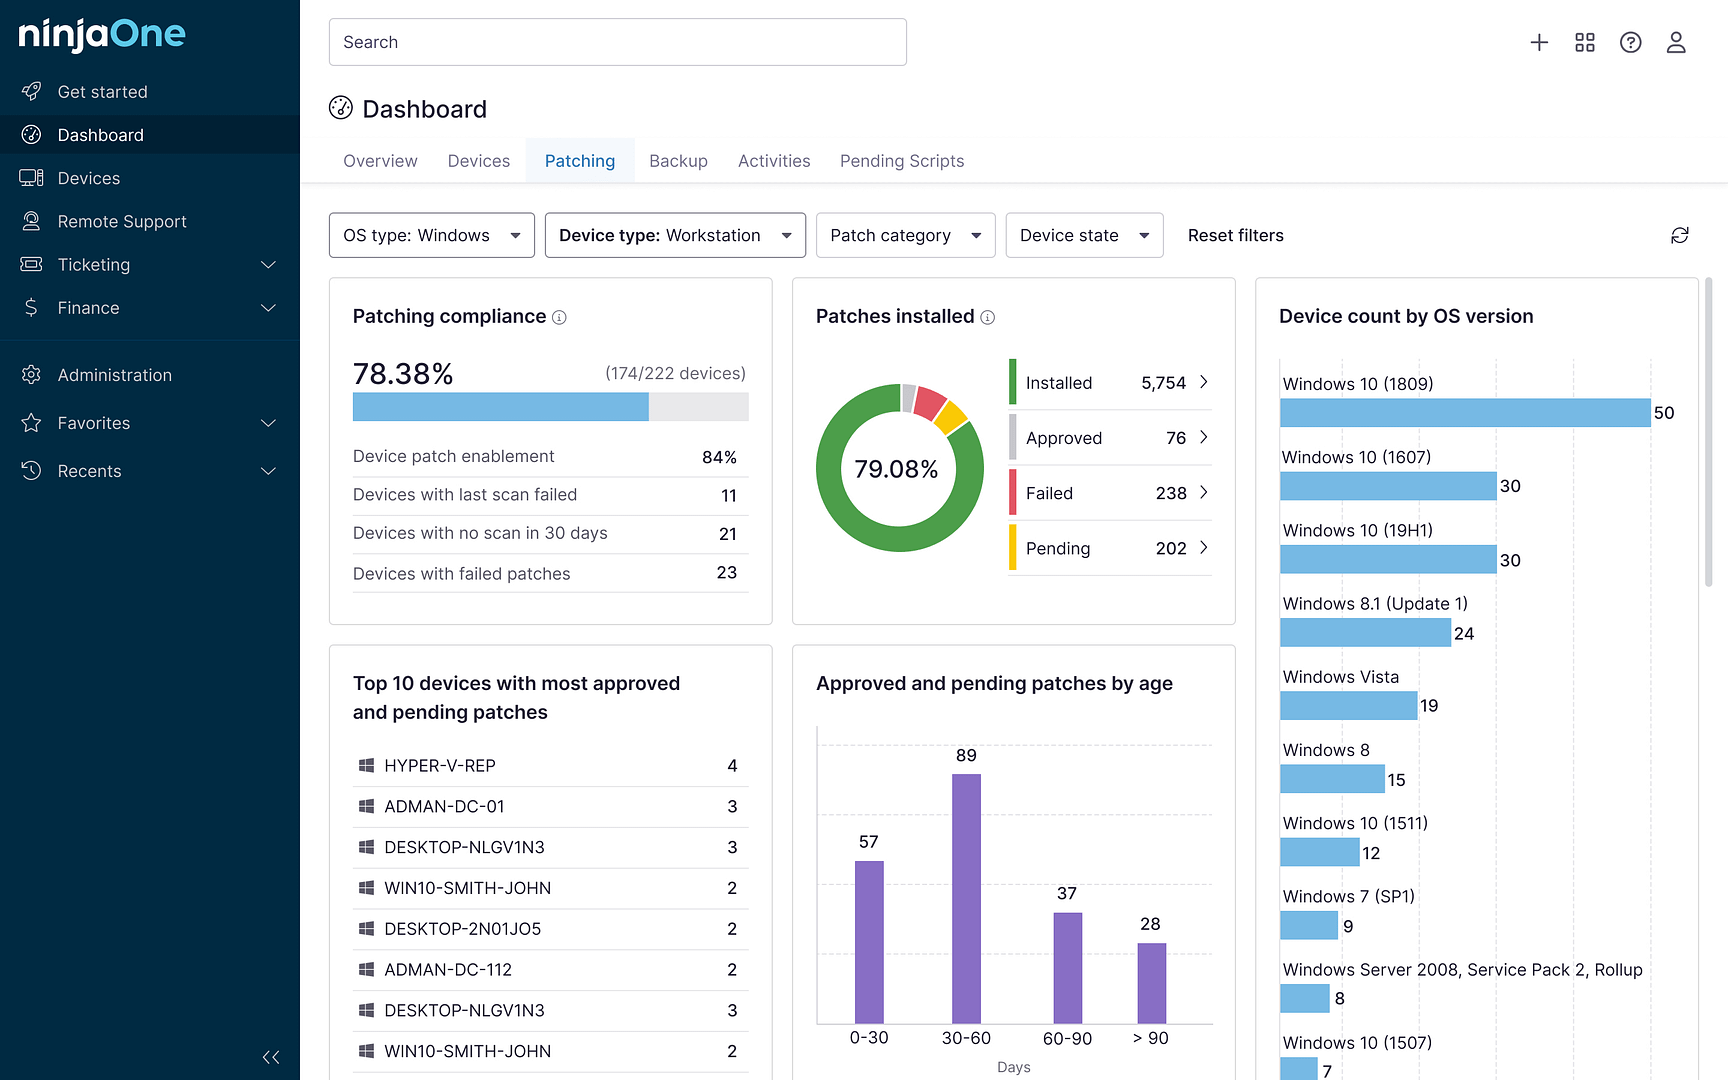
Mastering the analysis tools on how to create local Windows performance reports can be a game-changer for optimizing system monitoring. When your applications need to run at peak efficiency, Windows performance reports offer invaluable insights to help you maximize resource usage, prevent bottlenecks, and maintain system health. The built-in monitoring capabilities help track critical metrics and generate comprehensive reports for informed decision-making.
How to create a performance report in Windows
Creating performance reports in Windows requires a structured approach to data collection and analysis. The process combines automated tools with customizable parameters to generate comprehensive system insights. Local Windows performance monitoring tools offer multiple paths for report generation based on specific requirements.
Command line techniques
PowerShell commands provide precise control over performance data collection. These commands integrate with scheduling tools and scripts to automate report generation.
- Get-Counter captures performance data in real time and enables CSV exports to track resource utilization across specified time intervals.
- Export-Counter processes performance log files and converts them into accessible formats like HTML reports and Excel workbooks.
- Import-Counter facilitates data analysis by loading historical performance logs for trend comparison and baseline measurements.
Performance monitor interface
The graphical interface simplifies report creation through an intuitive workflow. To enhance monitoring precision, Data Collector Sets organize performance counters into logical groups for targeted data collection. Additionally, report templates come equipped with pre-configured settings tailored to common monitoring scenarios, saving you time and effort. For even greater flexibility, custom views allow precise control over how data is presented, offering a range of visualization options.
Automated tracking tools
Automated tools enhance performance monitoring by reducing manual intervention and ensuring consistent data collection. These tools form the backbone of systematic performance tracking and reporting.
- Task Scheduler integration enables report generation at specified intervals without manual intervention.
- Alert threshold monitoring triggers automatic data collection when specific conditions occur.
- Report generation scripts combine multiple data sources into consolidated performance summaries.
- Data filtering options help focus reports on relevant metrics and time periods.
- Export automation sends reports to designated network locations or email recipients.
- Historical data retention policies manage long-term performance tracking requirements.
The basics of local Windows system performance
Performance Monitor in Windows serves as a central hub for tracking system health and resource utilization. While measuring basic metrics forms the foundation of performance tracking, advanced features let system administrators dig deeper into resource patterns and usage trends. The tool excels at collecting comprehensive data about CPU usage, memory allocation, disk activity and network throughput across the Windows environment.
Performance data collection spans multiple categories, from real-time monitoring to long-term trend analysis that reveals patterns in resource consumption. Built-in reporting tools streamline the process of gathering critical performance metrics, setting baselines and identifying potential bottlenecks before they impact operations.
Core Windows performance tracking tools
The built-in local Windows performance utilities form an integrated toolkit for system analysis. These components work together to gather actionable data about resource usage and system health.
Core monitor functions
The Performance Monitor interface in Windows serves as the primary system tracking tool. This centralized console provides access to hundreds of performance counters that measure everything from processor time to memory pages per second. The real-time monitoring features display current system status through customizable graphs and data views that update automatically. Performance logs store historical data for trend analysis and capacity planning.
Resource measurement tools
Resource monitoring tools extend beyond basic performance tracking to provide detailed insights into system behavior. Here are some tools to consider:
- Task manager: Provides real-time process monitoring with CPU, memory and disk usage metrics while offering basic performance graphs.
- Resource monitor: Displays detailed system statistics through CPU, memory, disk and network tabs with filtering capabilities for specific processes.
- Process explorer: Reveals in-depth system information including process trees, handle details and DLL relationships for advanced troubleshooting.
- Data collector sets: Enables customized performance metric collection through templates or user-defined parameters for scheduled data gathering.
Performance data types
Windows tracks multiple categories of performance data to provide a complete picture of system health. Each metric category contributes to a complete understanding of system performance and helps identify areas for optimization.
These data types enable thorough analysis of system behavior and resource utilization patterns:
- Memory metrics measure available RAM, page file usage and cache effectiveness across the system.
- Processor counters track CPU utilization, thread counts and processor queue length for performance analysis.
- Disk activity data reveals I/O patterns, queue lengths and response times that impact system responsiveness.
- Network interface metrics monitor bandwidth usage, packet transmission rates and connection states.
- System objects track handle counts, thread creation and other low-level performance indicators.
- Application-specific counters measure performance metrics unique to installed programs and services.
Key Windows performance tracking metrics
Understanding local Windows performance tracking begins with identifying system indicators. Performance monitoring in Windows relies on key metrics that determine overall system health and resource utilization patterns. These indicators form the foundation for effective system analysis and optimization decisions.
Critical system indicators
CPU utilization serves as a primary indicator of system performance, revealing processing bottlenecks and application demands. Complementing this, memory usage patterns show how effectively the system manages available RAM and virtual memory resources.
Disk activity metrics further enhance the analysis by tracking I/O operations, revealing storage subsystem performance and potential bottlenecks. Finally, network throughput measurements demonstrate bandwidth utilization and connection status across system interfaces.
Resource threshold alerts
Alert thresholds establish boundaries for normal system operation and trigger notifications when metrics exceed acceptable ranges. By offering early warnings, these configurable limits help prevent resource exhaustion and maintain system stability.
Threshold monitoring spans multiple performance categories, from processor queue length to available memory pages. To be effective, each threshold must be carefully calibrated to align with typical workload patterns and system capabilities.
Performance bottleneck signals
System bottlenecks often manifest through distinct performance patterns that indicate resource constraints. For instance, high processor time combined with sustained queue length suggests CPU saturation. Similarly, excessive page faults paired with a low available memory point to potential memory limitations that require attention.
Disk queue length and prolonged response times reveal storage subsystem challenges, while spikes in network latency or frequent connection timeouts point to potential bandwidth or connectivity issues. By understanding these signals, you can proactively identify performance limitations before they impact system stability.
Strategic performance data application
Once bottlenecks are identified through performance patterns, report analysis becomes the next critical step in driving system improvements. This localized performance data serves as the foundation for implementing targeted enhancements, enabling you to not only resolve current issues but also proactively fine-tune your system for sustained efficiency and stability.
Report interpretation methods
Performance reports reveal system behavior patterns through statistical analysis and metric correlation. The interpretation process begins with baseline comparisons that highlight deviations from normal operation. Advanced analysis techniques combine multiple performance indicators to build a comprehensive view of system health and resource utilization patterns.
System trend analysis
Trend analysis examines performance data across extended time periods to identify recurring patterns and gradual changes in system behavior. This longitudinal approach helps predict future resource requirements and potential bottlenecks. Historical data comparison also reveals seasonal variations and growth trends that impact capacity planning decisions.
Local optimization paths
The collected performance data guides system optimization through multiple approaches:
- Resource allocation adjustments maximize system efficiency based on actual usage patterns and workload requirements.
- Service configuration changes improve performance by aligning system parameters with observed utilization trends.
- Hardware upgrade decisions rely on concrete performance metrics rather than assumptions about system needs.
- Workload distribution strategies optimize resource usage across available system components.
- Performance threshold refinements verify that monitoring parameters match actual operating conditions.
Optimize local Windows performance monitoring
Accelerate Windows performance monitoring and system management through NinjaOne’s comprehensive endpoint management platform. The solution delivers advanced performance tracking, automated task execution and enhanced system visibility across your Windows environment. Experience the power of unified endpoint management with a free NinjaOne trial.


