Server and IT infrastructure monitoring are critical to ensuring the performance and longevity of your client systems. Even more so, remote monitoring technology, in particular, has helped define the entire modern IT industry.
In this post, we’re going to discuss several of the main monitoring concepts, including metrics, alerting, and monitoring, and why they are important. We will then advance into IT monitoring and alerting best practices, as well as how to choose software for server monitoring and reporting.
What this article will cover:
Server monitoring allows IT professionals, to track performance, health, and status data about a server — for example CPU load, memory utilization, active processes, and disk space levels. Monitoring is typically tied to an alerting system that notifies key personnel if any critical events occur or specific thresholds are reached. This real-time reporting allows system administrators to remedy the situation and avoid further issues quickly.
What is server monitoring and alerting?
Key to the concept of a remote monitoring system are the elements of metrics, monitoring, and alerting. Metrics are simply the data input needed for measuring and monitoring server performance, health, and availability.
Monitoring is the associated aspect that allows IT professionals to read and interpret this incoming data to gain insight into how applications and systems are performing. Monitoring involves collecting, aggregating, and analyzing the metrics in a meaningful way.
Alerting is built on top of these other two elements. Whenever specified metrics meet conditions in a defined way, the monitoring element sends notifications to designated individuals so that they can track down and remediate any problems.
What is the purpose of server monitoring?
Because a server monitoring system allows you to gather, store, and visualize metrics, events, logs, and traces in real-time, it enables you to glimpse the bigger picture of what’s happening across your infrastructure in real-time.
Most monitoring solutions allow users to aggregate or analyze both current and historical data that has been retained or archived. The ability to analyze data over longer periods of time provides valuable insight you can see only when you can examine the big picture and see trends over time. The best monitoring solutions allow for customized visualization and reporting of data, allowing you to create robust graphs and charts that make understanding key metrics even easier. Such systems also give sysadmins the ability to correlate data from different inputs and monitor how various resources relate across different environments or groups of servers.
Additionally, one of the most important benefits of server monitoring is alerting.
It can be challenging — sometimes nearly impossible — to measure performance at all levels of the deployment, including components, applications, and services. This is even more true for managed IT service providers who are responsible for monitoring and managing IT environments across numerous clients. In addition to the visibility gained by centralizing application and infrastructure monitoring, log management and analysis, tracing, real user, and synthetic monitoring, the best monitoring solutions will provide timely alerts that ensure even small IT teams stay on top of large technological ecosystems.
What server metrics should be tracked and reported?
We know that metrics are the raw data about resource usage, behavior, or performance that your monitoring system collects from within your infrastructure. These metrics can be fed into your monitoring solution via installed agents or through an agentless system. They can also be collected directly from the operating system or an application.
Operating system metrics usually include baseline information about resources such as CPU, RAM usage, and disk space. These are readily available bits of data that can be sent easily to your monitoring system.
Other components, hardware, and custom applications require integrations, agents, or other means of transferring the relevant data. This is where code or agents must be installed to interface with the monitoring tool.
Regardless of how data is collected, it’s important to know which data points beyond basic resource usage need to be tracked and reported. While every use case varies, there are some basics that should always be considered.
Events
Many monitoring systems can also capture events that are typically generated and collected at the time they occur. Event data fed into a monitoring tool will typically provide an overview of what happened, where it happened, and when. When examined alongside other metrics, IT professionals can more readily troubleshoot the root cause of an issue.
Logs
It’s not generally possible to troubleshoot issues with metrics alone. Logs fill in the information gaps by providing information about what applications, services, and even users have been doing within the IT environment. In essence, logs are a “paper trail” of events that show activity which is extremely valuable for troubleshooting. As you can imagine, log data of all network traffic can rack up fairly quickly and is often impossible to monitor manually. For this reason, monitoring and reporting solutions typically allow alerts to be configured for specific log activity, similar to how events and metrics can trigger timely notifications.
Why is server monitoring and reporting important?
IT professionals find that there are many benefits to server monitoring and alerting.
As mentioned earlier, even simple metrics help system admins remotely access and understand the current health of their infrastructure and applications. Alert rules and notifications make this even more beneficial.
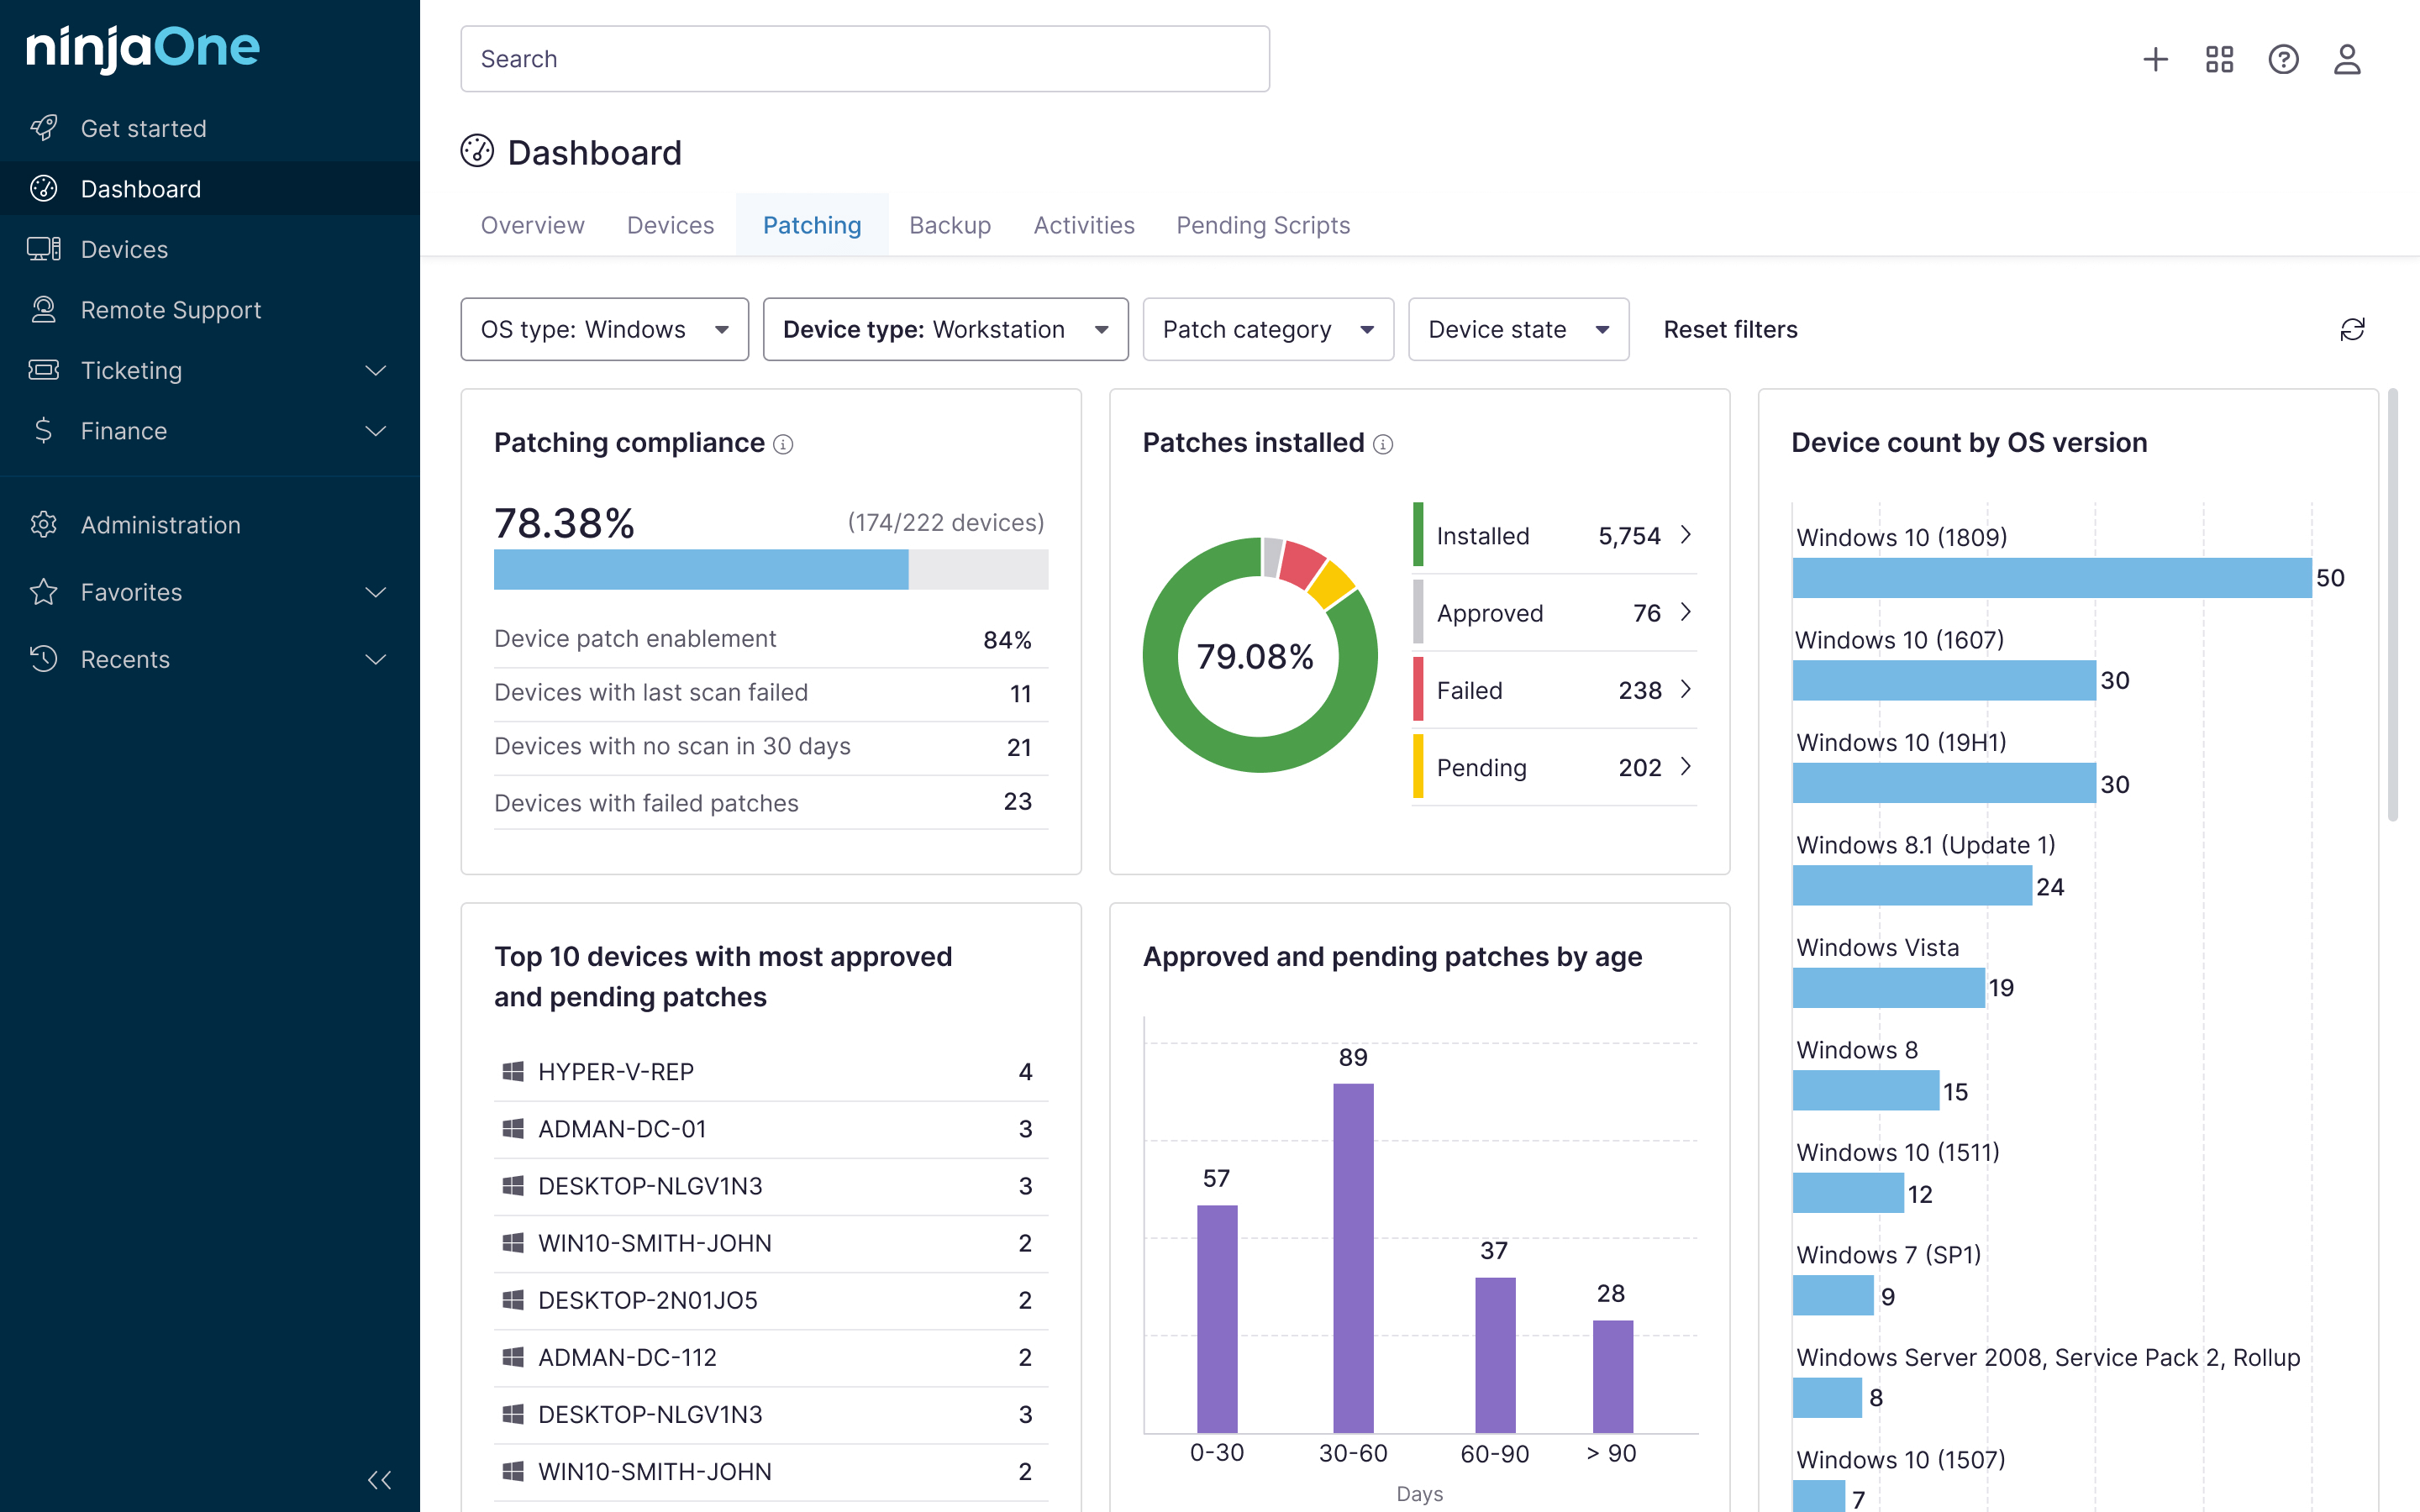
Perhaps the most overwhelming benefit is the aggregation of large amounts of valuable data into a single dashboard, especially when the monitoring tool provides a centralized, multitenant means of tracking numerous disparate systems.
In addition to facilitating this kind of large-scale monitoring across different clients or environments, benefits include:
Notification of when there is or could be a server issue
By and large, the most critical function of server monitoring is real-time remote alerting of potential issues that threaten the stability of the IT environment. Such alerts allow IT professionals to quickly remedy potentially dangerous situations to keep the server running. This data allows for a far more proactive approach to IT management.
Providing a clear overview of all systems
With larger server and network setups, it’s difficult to keep an eye on every important aspect — especially when they are physically located in different places. Remote server monitoring lets IT professionals keep a detailed overview of all systems via a unified dashboard. Without this functionality, the IT industry would hardly be able to provide customer support that’s up to modern standards.
Fuel smarter decision-making with historical data
Server monitoring solutions give insight into the hours, days, and weeks leading up to a critical issue. This lets you determine if the issue built up slowly over time, or failed spontaneously. Knowing why issues are occurring, and what has occurred before, will help you make better decisions about resource allocation, budgets, asset management, or hardware replacements.
Ensuring better server performance over time
Ongoing alerts, overview dashboards, and historical data allow IT pros to truly master their server management and give them deeper insight into what has worked and what hasn’t. These details allow for far more accurate optimization.
Server monitoring best practices
There are several key points when it comes to setting up remote server monitoring. The right setup can ensure proactive IT management through alerting and monitoring. The following are some key best practices we’ve identified:
- Begin by monitoring both underlying system components and the system in its entirety. This will give you a big-picture look at how your system components behave as well as how they influence each other.
- Define your alerts based on deviations from baseline performance. Remember to use historical data to establish how many standard deviations are allowable when creating alert thresholds.
- Hone your alerts and reporting rules to avoid false alerts. (Remember “the boy who cried wolf”.) Too many false positives will lead to alert fatigue, which usually leads to alerts being ignored.
- If you’re monitoring a dynamic infrastructure, you may decide to focus only on monitoring services and not on individual components.
- Set defined rules around the deployment of new services or infrastructure. Be sure that new infrastructure, hardware, or services don’t go to production without monitoring and suitable alert rules in place.
- It’s important to monitor your IT from the viewpoint of real-world users. Capture metrics from actual users and from their true geographic locations.
- Don’t neglect third-party services in your monitoring. Problems with a third party can just as easily affect the overall experience of your users and can lead to real or perceived issues within your own infrastructure.
- As with all processes, it’s a good idea to evaluate and update your monitoring strategy regularly to keep in step with changes in your environment.
- The best monitoring solutions can be used to benchmark against other IT environments to identify areas that need improvement and help improve response times.
Choosing the best server monitoring and alerting software
Not all network monitoring systems are created equally. Your best option will depend largely on your use case and the needs of your IT environment. For the managed service provider (MSP) specifically, we recommend a solution that offers all of the features necessary for monitoring and managing many different clients. Review the video guide on Server Monitoring and Alerting.
Among the features, you should look for are RMM software, patch management, SNMP, NetFlow, and Syslog notification monitoring.
IT monitoring and management is no longer a question of “if”, but a question of “how”. Understanding the solutions used to conduct such monitoring is the first step to leveraging the power of server monitoring and alerts. Setting up a monitoring system can seem daunting, but the right tools can take the headache out of this important task. The final result? You and your team will be empowered to detect and solve issues faster and more reliably while making the best use of your time and resources.
NinjaOne RMM for server alerting & monitoring
- Robust Monitoring & Alerting
- Powerful, Easy-to-Use Remote Monitoring and Management platform
- Easy IT Automation
- Comprehensive Patch Management
- Fast, Secure Remote Access
- Integrated Cloud Backup
Start your free trial of NinjaOne today.


