Learn more about NinjaOne’s health monitor network. Network health encompasses the seamless operation and optimal performance of all devices and connections within a network, ensuring uninterrupted business continuity. Key aspects include device availability, data transmission speed, security posture, and overall system stability.
NinjaOne’s comprehensive network monitoring solutions empower businesses to proactively safeguard their network health by providing real-time visibility into device performance, identifying potential issues before they impact operations, and enabling swift resolution to minimize downtime and maximize productivity.
How to Monitor Network Device Health Using NinjaOne?
NinjaOne offers a variety of resources for our Network Monitoring Solutions (NMS) tool. To help you find the information you need, please refer to this catalog for a comprehensive guide of NMS configuration.
Network Management Software (NMS) is a network monitoring solution designed to manage devices on a network, typically via SNMP, when a NinjaRMM agent cannot be installed (e.g., routers, switches, firewalls, printers, etc.).
Things to consider before installing NinjaOne NMS:
The default installation with Smart Policy assignments works well on a quad-core system with 8 GB of RAM for basic monitoring. However, if you plan to monitor larger networks, use the Network Traffic Flow module, or monitor SNMP traps/syslogs, you need to account for system and hardware requirements based on the number of devices.
Key scalability considerations before installation:
- Number of devices: Monitoring 100+ devices may require system performance tuning.
- Data collection per device: More monitors per device increases data volume.
- Time intervals: Shorter intervals (e.g., 5 minutes) may require a high-performance server.
For optimal performance, especially when collecting traffic analysis, use a dedicated high-performance server if:
- Collecting Traffic Flow data from multiple routers/switches.
- Monitoring more than 100 devices.
- Monitoring SNMP traps/syslogs or capturing configuration backups.
NinjaOne NMS supports most common models of Cisco, Dell, HP, NETGEAR, and also devices that support the standard MIB-2 protocol. That said, certain makes/models may not display data as they deviate from the standard OIDs for CPU, Memory, Network adapters etc.
NMS Agent Architecture:
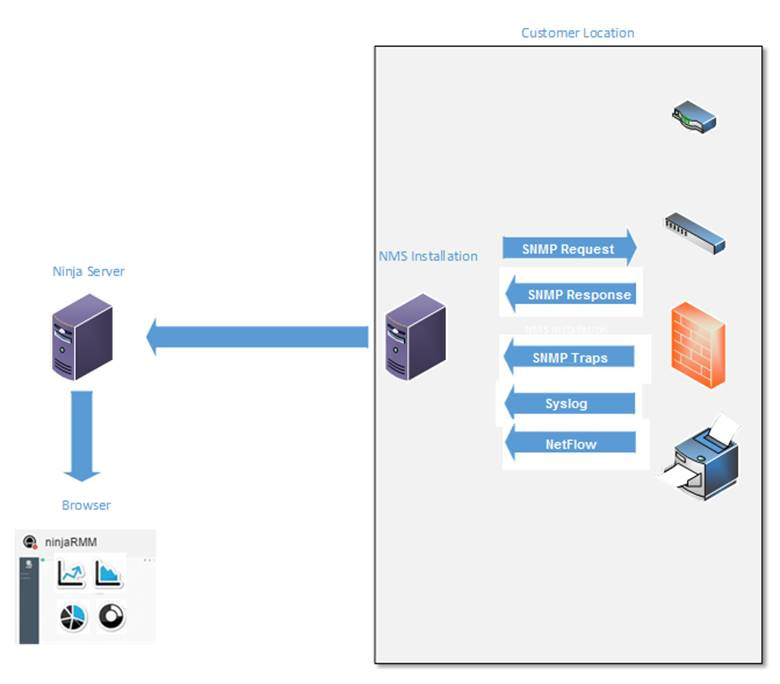
To use NinjaOne’s network management suite, deploy the NinjaOne NMS agent separately for every customer whose SNMP-capable devices you want to monitor.
The NMS agent is a separate installation from the NinjaOne monitoring agent, but both agents can be installed in parallel. The NMS agent is used to perform network discovery (manually), and the associated devices will be added to the System.
The dataflow is illustrated in the following diagram:
Run Network Discovery:
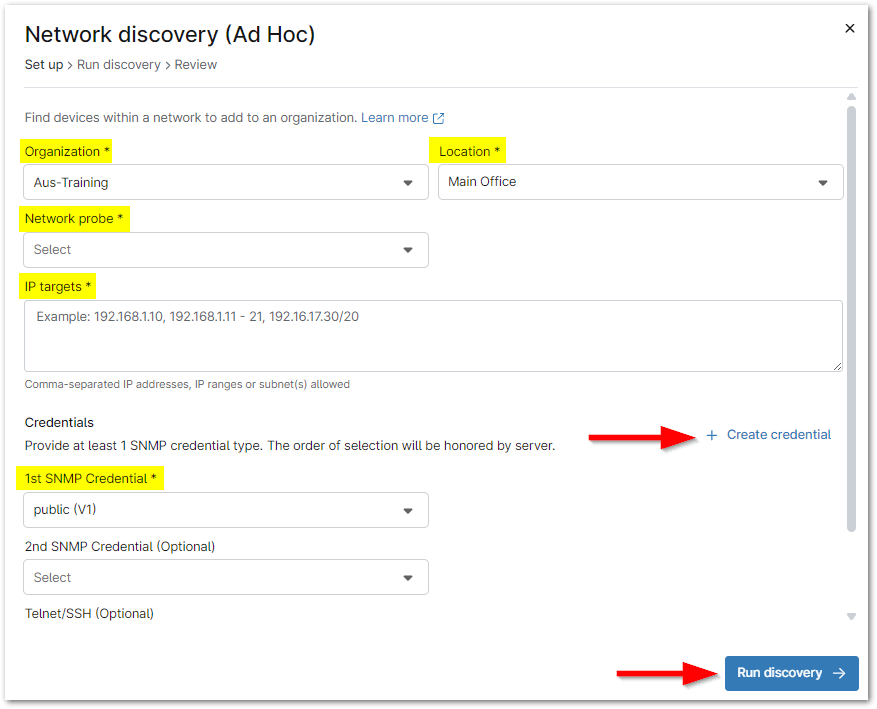
1. In the upper-right section of the NinjaOne console, go to Add (+) > Device > Run Ad Hoc Network Discovery.
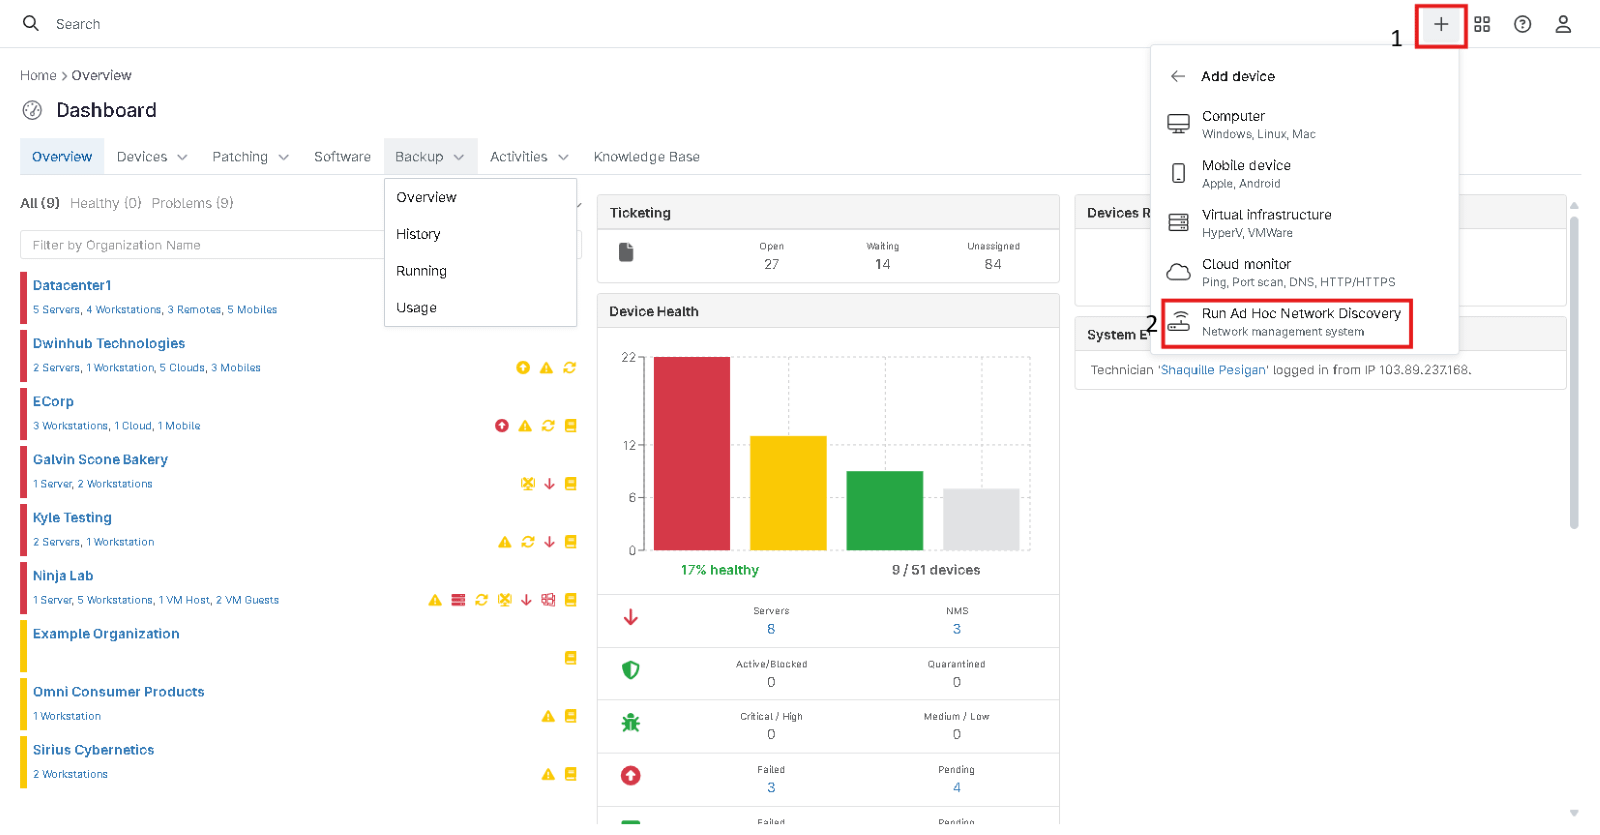
The Network Discovery wizard opens.
2. From the drop-down lists, select an organization and location. If an organization has only one location set up, then the Location field should auto-populate based on the organization selected.
3. From the Network Probe drop-down list, select a device to perform the network discovery. This will contain all the Windows devices with the NinjaRMM agent installed, are online, and running one of the following operating systems:
- Windows 10
- Windows 11
- Windows Server 2016
- Windows Server 2019
- Windows Server 2022
4. In the IP Targets box, enter comma-separated IP addresses, IP ranges, and/or subnets for your discovery range. For example:
- 192.168.1.1, 192.168.1.2, 192.168.1.3
- 192.168 — 3
- 192.168.1.0/24
5. Under Credentials, select at least one SNMP credential.
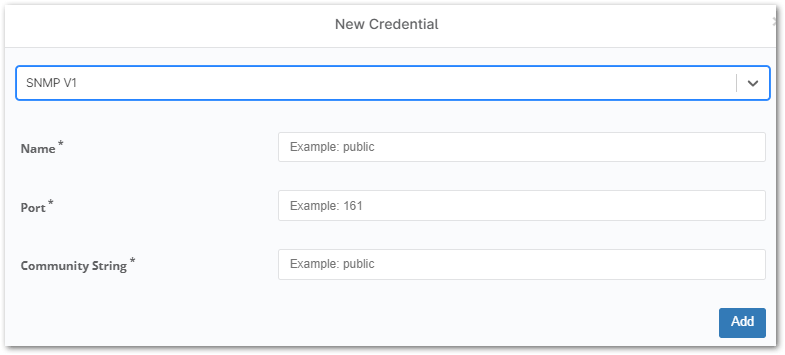
If your credential is not listed, click Create credential, and then select a credential type (SNMP v1, SNMP v2, SNMP v3, or Telnet/SSH). New fields will be displayed, as outlined by the table below.
Important Note: SNMP is used to discover, profile, and monitor your devices. SNMP community leverages a string to access the router network device and is only available with SNMPv1 and SNMPv2c protocols. SNMPv3 requires username/password authentication as well as an encryption key.
| Credential Type | Credential Settings |
| SNMP v1 and v2 |
|
| SNMP v3 |
|
| Telnet/SSH |
|
- When you have completed your entries, click Add. Your credentials are now available from the Credential drop-down lists.
6. (Optional) From the second SNMP drop-down list, select a credential. If necessary, this credential will also be tried in addition to the first one selected.
7. (Optional) From the Telnet/SSH drop-down list, select a credential.
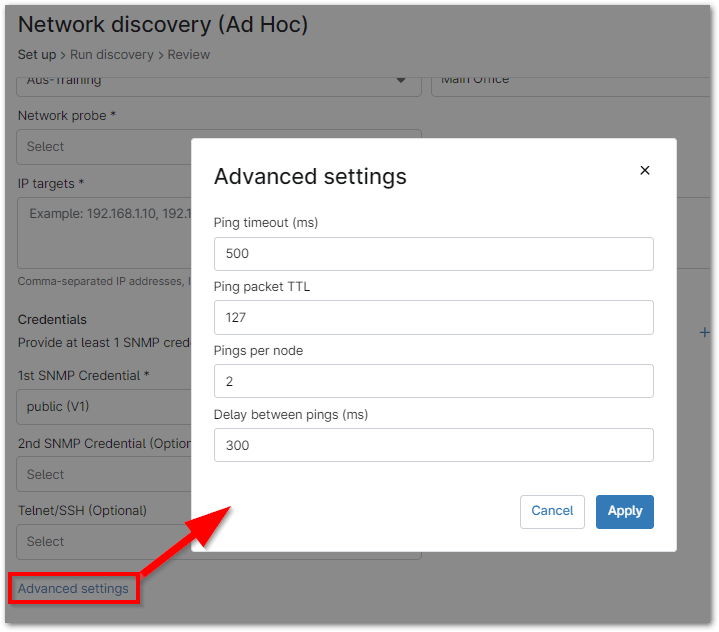
8. (Optional) To apply ping conditions for network discovery, click Advanced settings (see below for descriptions). If your device is not local (e.g., on a VPN), NinjaOne suggests increasing the ping timeout and TTL.
9. Click Run Discovery. You can also click the X in the top right corner of the modal at any time to stop the current discovery process.
For any device that has not been previously used as a network probe, NinjaOne will create a new service on it that promotes the device to become the NMS delegate. The service is under the name “Ninja NMS Manager Service” and the corresponding process name is “nmsmanager.exe.”
Advance Settings
Ping is a useful tool for testing network connectivity by sending packets of data and measuring the response time.
| Setting | Description |
| Ping timeout (ms) | Specify how long, in milliseconds, to wait for a reply. This means the initial packet is sent, waits for a reply, and gives up at a preset timeout. |
| Ping packet TTL | Allows you to set for TTL (time to live) at a specified threshold. |
| Pings per node | Specify the number of pings sent to each host to test if the host successfully responds to each. |
| Delay between pings (ms) | Specify the number of milliseconds that pass between each ping. |
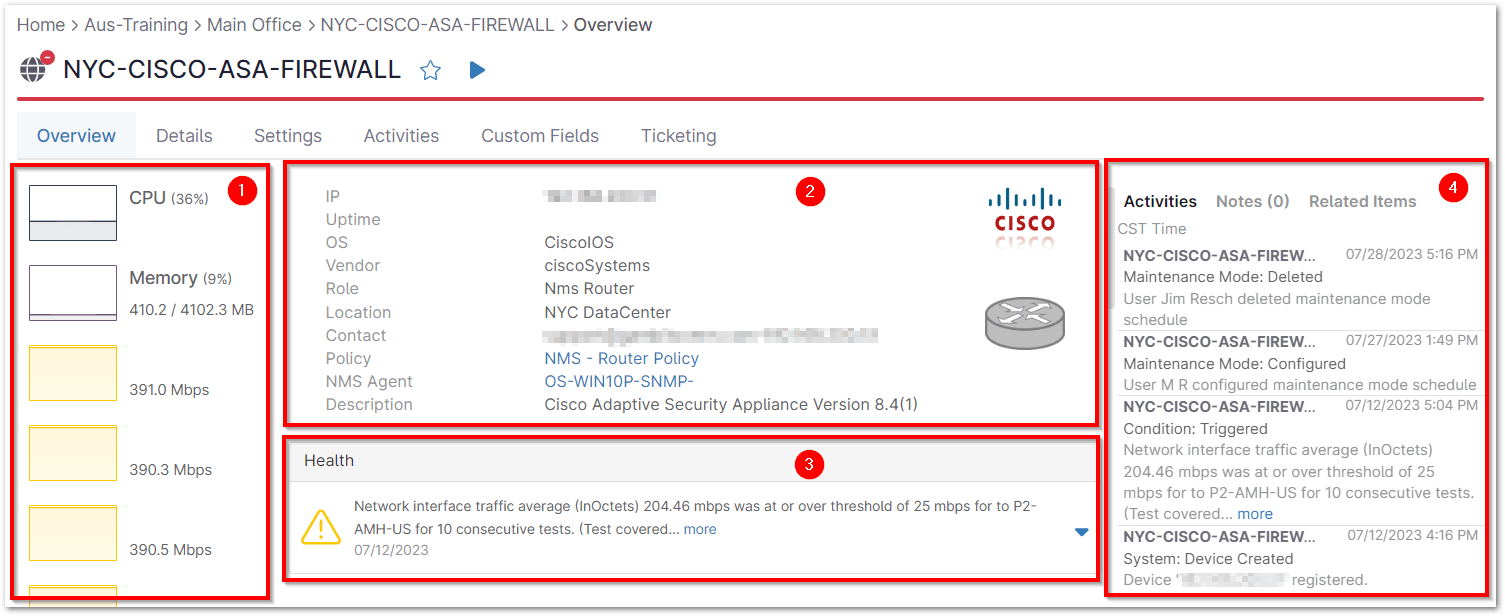
NMS Device Dashboard
Performance
Shows the CPU and Memory usage for the device. For CPU, memory, and volume(s), the current percentage will also be listed in parenthesis.
General
Shows device details at a glance; additional device details can be found under the Details or Settings tabs.
Some fields like system name are pulled from location depending on specific criteria needing to be met. Most commonly, you will see operating system/model, product key/serial number, IP address, device name, uptime/connected status, organization, policy, antivirus, and patch management.
Health
This section only displays when there are active threats or conditions triggered for the device. Use the down arrow on the right side of the widget to see remediation options, including ticket creation or device reset.
Activities, Notes, and Related Items
- Activities—shows device-specific events and actions taken on the device, such as installations, scans, automations, patch warnings, etc. These notes also display under the Activities tab on the dashboard.
- Notes and Related Items—the Notes tab next to Activities shows all messages related to the device. The Related Items tab next to Notes and Activities shows all items related to the device.

