Network and server reliability is critical in today’s IT environment. Server and network monitoring tools are essential for maintaining uptime, enhancing performance, and ensuring security. Since routers act as the gateway to network infrastructure, effective router monitoring is necessary to prevent bottlenecks and vulnerabilities. NinjaOne offers a user-friendly platform that includes a monitor router, tracks router history, and supports advanced network management strategies.
Navigating and Managing Router Monitoring in NinjaOne
First, ensure that you have already added your router for monitoring in NinjaOne. For detailed instructions, refer to our documentation on adding NMS devices.
To begin, navigate to the Main Dashboard > Organization > and select the router you want to monitor.
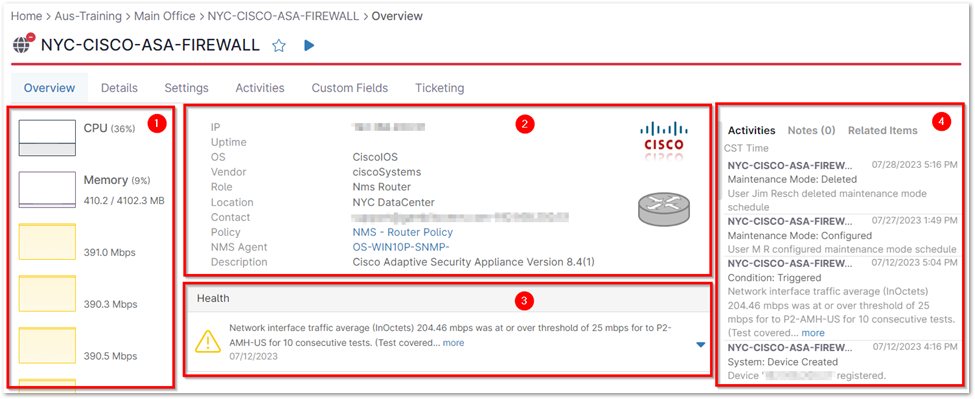
Below, you will find an overview of how to navigate and utilize the available tools for monitoring NMS devices in NinjaOne. The device dashboard highlights key areas for tracking and managing router performance, health, and activities:
- Performance
- General
- Health
- Activities, Notes, and Related Items

Performance
The Performance section provides real-time data on CPU and memory usage, with the current percentage listed in parentheses for each, as well as port statistics.
General
In the General section, you’ll see an overview of important device details, including the operating system, IP address, device name, uptime, connected status, organization, policy, and description.
Health
The Health section only appears if there are conditions triggered for the device. You can use the down arrow on the widget to access remediation options such as creating a ticket or restarting the device.
Activities, Notes, and Related Items
- Activities: Displays device-specific events and actions, such as installations, scans, automations, and patch warnings. These are also available under the Activities tab on the dashboard.
- Notes and Related Items: The Notes tab shows all messages related to the device, while the Related Items tab displays items linked to the device.
Telnet and SSH for Network Discovery
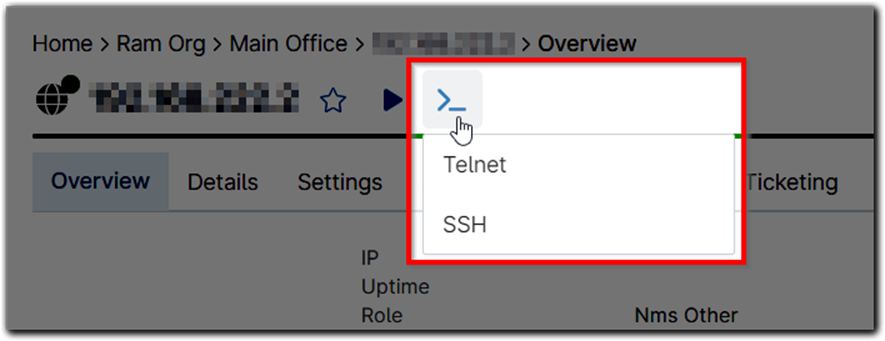
To access Telnet or SSH for network discovery, ensure the device is connected and you have the necessary permissions for command line or terminal access. Hover over the Terminal >_ icon next to the device name in the NMS dashboard to access the Telnet and SSH options:
- Telnet: A protocol for remote access to systems over LAN or the internet.
- SSH: A secure protocol for remote login between computers.
The session will open in a new tab, and an activity log will be created for the terminal session.

Settings Options
The Settings tab offers a detailed view of device specifications and the apps enabled on the device. You can disable specific apps for the device or change settings such as the assigned user or device role.
Change Monitoring Settings
Under the Settings tab, you can choose to monitor the device by IP address, NetBIOS name, or DNS. To update the monitoring settings:
- Scroll to the bottom of the page and click Edit next to the Monitor by section.
- Select the desired option from the dropdown and enter the required information.
- Click Save.
Other configurable settings
- Rename Device: Update the device’s name for easier identification.
- Change Assigned User: Reassign the device to a different user.
- Change Organization/Location: Update the organization or physical location associated with the device.
- Change Policy: Apply a new policy configuration to the device.
- Change Device Role: Modify the device’s designated role within the system.
Custom Fields
The Custom Fields tab allows you to view any custom fields set up in Administration > Devices > Role Custom Fields or Global Custom Fields.
Ticketing
If the Ticketing app is enabled, the Ticketing tab at the device level allows you to manage tickets assigned to that specific device. This offers an alternative to the Ticketing dashboard, which shows tickets across all devices and organizations within NinjaOne.
Benefits of Using NinjaOne for Router Monitoring
- Centralized Visibility: NinjaOne consolidates router, server, and endpoint monitoring into a single interface, reducing the need for multiple tools.
- Ease of Use: The platform’s intuitive design minimizes setup time and ensures IT teams can act quickly on critical information.
- Proactive Alerts: Customizable thresholds and instant notifications allow for proactive resolution of network issues.
Strategies for Effective Router Monitoring with NinjaOne
1. Define Clear Monitoring Goals
- Establish key performance indicators (KPIs) such as latency, bandwidth usage, and uptime to focus monitoring efforts.
2. Leverage Automated Alerts
- Use NinjaOne’s alerting capabilities to notify the team of potential issues before they escalate. For instance, configure alerts for bandwidth thresholds to prevent network congestion.
3. Implement Scheduled Maintenance
- Use NinjaOne to schedule maintenance windows and temporarily suppress non-critical alerts. This ensures planned activities do not trigger unnecessary notifications.
Key Differences in Router Monitoring vs Router Management
The main difference between router monitoring and router management lies in their focus and purpose. Router monitoring involves using tools to track real-time performance metrics such as traffic, bandwidth, and uptime, ensuring the router is functioning efficiently and helping identify potential issues early.
In contrast, router management encompasses the broader tasks of configuring, updating, and maintaining the router, including setting security protocols, performing firmware updates, and managing user access controls. While monitoring ensures optimal performance, management ensures the router is properly set up, secured, and maintained for the long term.
