Monitor and show system uptime with NinjaOne 

In this article, you will learn how to show system uptime on Windows. System uptime is a critical metric for IT professionals, reflecting the reliability and stability of servers and workstations. Monitoring system uptime helps ensure that IT environments are running smoothly, minimizing downtime and maximizing productivity.

This guide will explore how to monitor system uptime using NinjaOne, covering various aspects such as Windows system uptime, server uptime, and server monitoring for uptime performance. By leveraging NinjaOne’s capabilities, IT professionals can efficiently track and manage system uptime, ensuring optimal performance and reliability.

How to Check System Uptime with NinjaOne

Monitoring system uptime with NinjaOne is effortless, thanks to its intuitive interface and automated data collection capabilities. Follow these simple steps to quickly track and monitor uptime for your devices:

1. Access the Devices List:

  • From the NinjaOne main menu, navigate to the Devices section to view a comprehensive list of all managed endpoints.

Navigate to the Devices section to view a comprehensive list of all managed endpoints. 

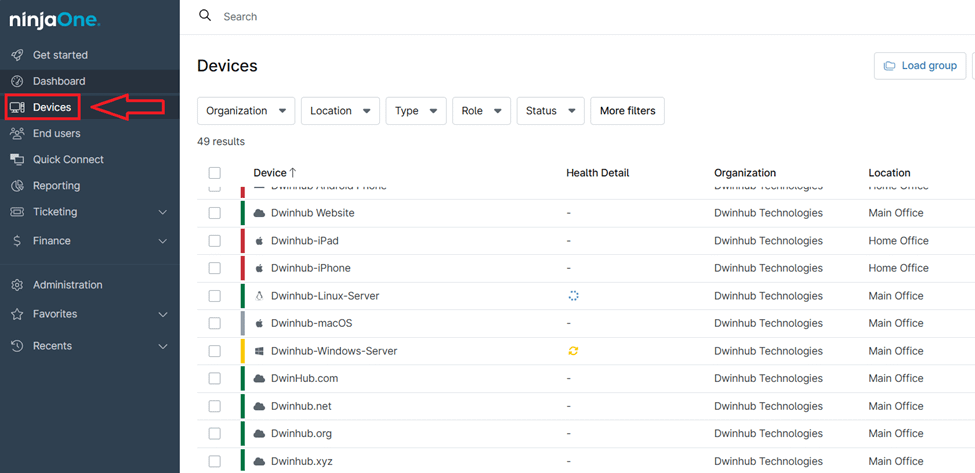
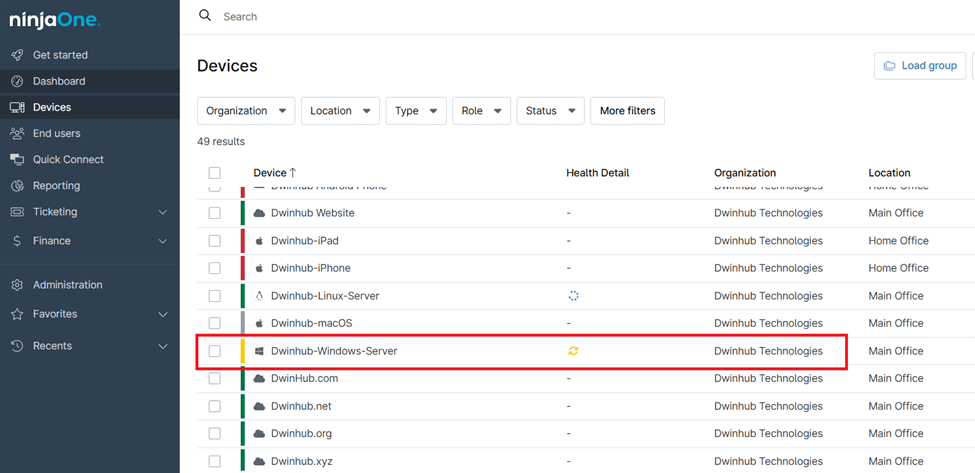
2. Select the Target Device:

  • Locate and click on the device you want to check uptime for, opening its detailed view.

Select the Target Device.

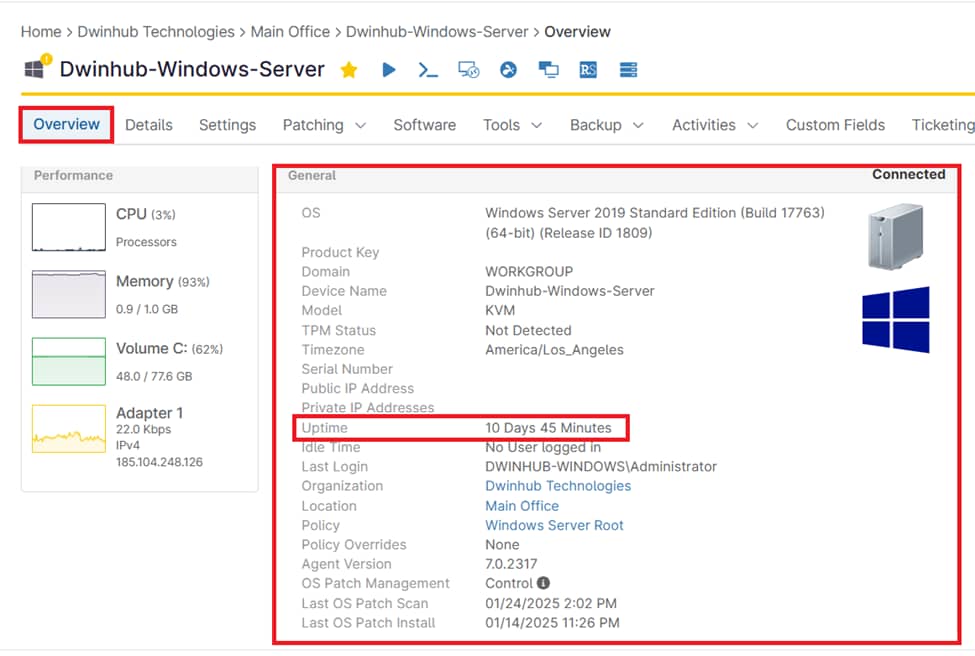
3. View Uptime Information:

  • In the Overview tab, under the General section, you can find the system uptime displayed alongside other essential details, including the operating system, product key, time zone, idle time, and more.

View Uptime Information.

Displaying System Uptime in the Device Dashboard

Easily track device uptime by adding the Last Boot Time column to your Devices dashboard in NinjaOne. Follow these steps to enable it:

1. Access the Devices dashboard by clicking on Devices from the left menu

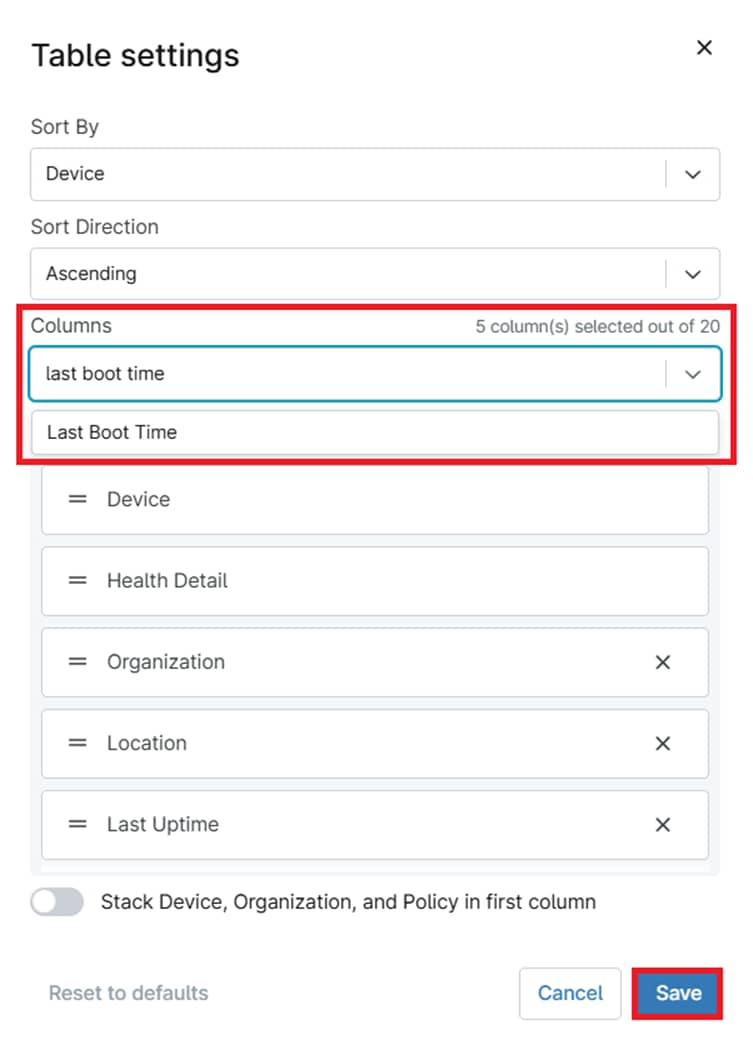
2. On the Devices dashboard, click the gear icon in the top-right corner to open Table Settings.

Click the gear icon in the top-right corner to open Table Settings. 

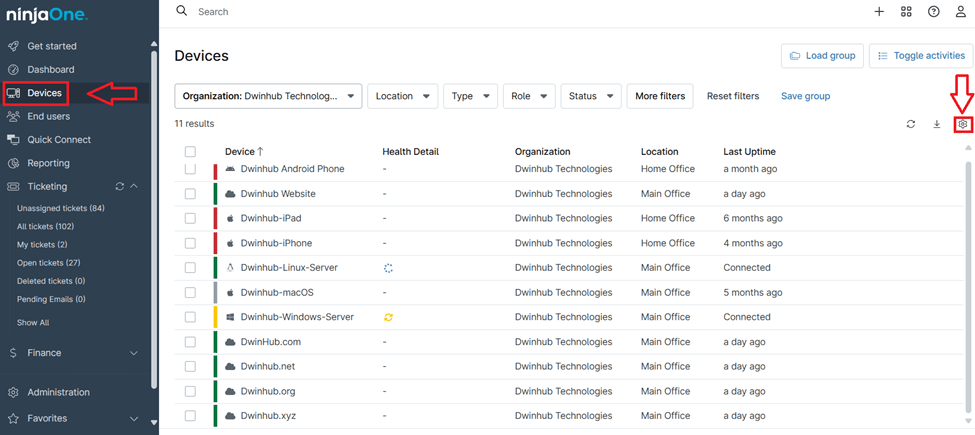
3. In the Table Settings modal, locate the Columns section, select Last Boot Time, and click Save to apply the changes.

Select Last Boot Time, and click Save to apply the changes. 

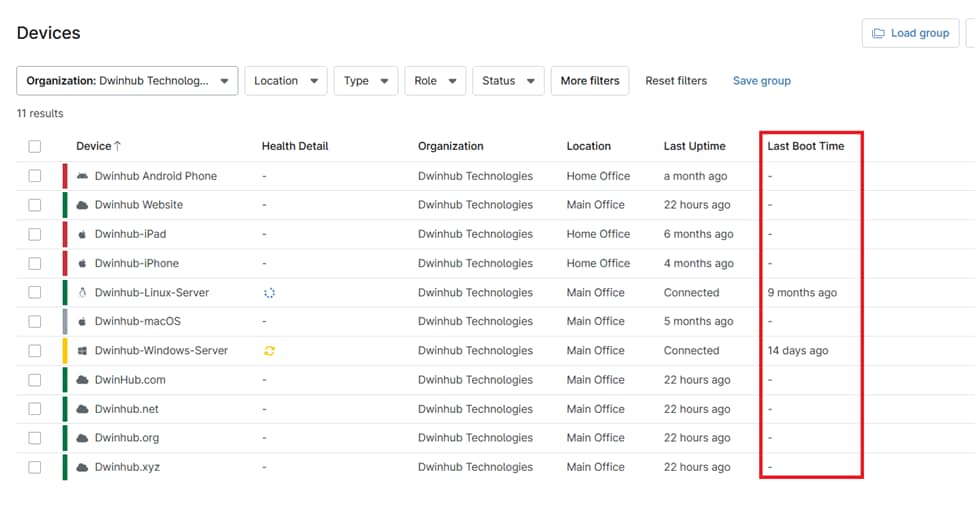
4. The Last Boot Time column will now be displayed in the Devices dashboard, showing the most recent boot time for each device.

Last Boot Time column will now be displayed in the Devices dashboard

Real-World Applications of Uptime Monitoring with NinjaOne

  1. Windows Server Uptime Monitoring:
    Managed service providers (MSPs) aiming for 99.9% uptime can leverage NinjaOne’s centralized monitoring and automated alerts to track server performance and promptly notify technicians of potential issues.
  2. Proactive Server Maintenance:
    IT administrators can use uptime metrics to identify servers running continuously for extended periods, allowing them to schedule reboots and prevent potential crashes due to resource exhaustion.
  3. Ensuring SLA Compliance:
    Enterprises can leverage uptime data to verify compliance with service level agreements (SLAs) and generate comprehensive reports for stakeholders.

FAQ

“Show System Uptime” refers to the process of checking how long a system has been running without a restart. It allows users to see system uptime, which is useful for monitoring device stability, diagnosing potential issues, and ensuring optimal performance.

To check system uptime in Command Prompt (CMD), you can use several methods. First, the systeminfo command displays the system boot time with systeminfo | find “System Boot Time”, allowing you to calculate uptime. Another method is net stats workstation, which shows the “Statistics since” timestamp, indicating the last reboot time.

Alternatively, the wmic os get lastbootuptime command outputs the last boot time in a format that can be manually converted to human-readable form. For a direct uptime calculation, you can use PowerShell from CMD with powershell -command “& {(get-date) – (gcim Win32_OperatingSystem).LastBootUpTime}”, which gives uptime in days, hours, minutes, and seconds.

A good system uptime is typically 99% or higher, but regular reboots are also essential for system health. For workstations, rebooting weekly or every two weeks is recommended to maintain performance. Servers and critical systems usually need a reboot every 30 to 90 days, often during scheduled maintenance.

Specialized systems like 24/7 devices should be rebooted at least once a month to avoid performance issues. Regular reboots help ensure systems run smoothly and efficiently while maintaining uptime.

To check system uptime using Task Manager, right-click on the taskbar and select Task Manager. If it opens in the compact view, click More details at the bottom to expand it. Next, go to the Performance tab and select CPU from the list on the left. At the bottom of the CPU section, you’ll find the Uptime value, which shows how long the system has been running since the last restart.

To check system uptime in Linux, open a terminal and run the command uptime. This will display the system’s uptime, along with additional information like the current time, how long the system has been running, the number of users logged in, and the system load averages.

Server time refers to the current time set on the server, often synchronized with a time server (like NTP) to ensure accuracy. It reflects the actual clock time on the server, similar to the time you see on any device.

System uptime, on the other hand, measures how long the system has been running since its last reboot. It does not include time when the system was powered off or in a suspended state, and is typically used to monitor the health and stability of the system over time.

In summary, server time shows the current time, while system uptime indicates how long the server has been continuously operating.

To check the uptime of a Windows Server, you can use Command Prompt or PowerShell. Open either tool and type the command systeminfo | find “System Boot Time”. Press Enter, and it will display the system’s boot time, indicating when the server was last restarted. You can calculate the uptime by comparing the boot time with the current date and time.

Alternatively, you can use Task Manager by going to the Performance tab, selecting CPU, and checking the Uptime value displayed at the bottom of the CPU section.

×

See NinjaOne in action!

By submitting this form, I accept NinjaOne's privacy policy.