
Switches are the backbone of your network infrastructure, and any issues with them can significantly impact network performance. Effective switch monitoring is essential to maintain a reliable and secure network. Monitoring both the hardware and the traffic flowing through switches ensures smooth operation and prevents potential disruptions. Network switch monitoring includes crucial functions such as switch port monitoring, performance tracking, and traffic analysis.
Specialized network switch monitoring tools, such as switchport mappers, traffic monitors, and performance analyzers, help administrators stay ahead of potential problems. NinjaOne provides an integrated platform that combines these monitoring capabilities, offering real-time insights to proactively manage and optimize your network and server infrastructure.
How to Manage Switch Monitoring in NinjaOne
The first step is to make sure that you have added your switch for monitoring in NinjaOne. For a comprehensive guide, check this documentation: ‘Add NMS Devices.’
Start by looking at the device-level dashboard for an NMS device in NinjaOne. Navigate to a device by selecting it through the Organization-level dashboard, the Devices tab, or the global search.
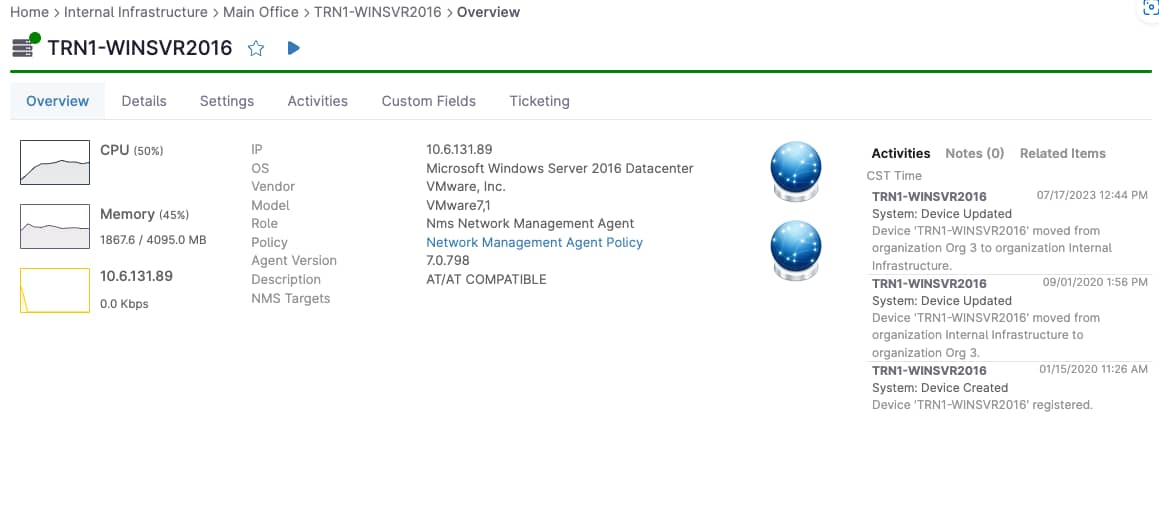
For a typical NMS device, or specifically a switch, we will generally see the following tabs at the device-level dashboard:
Overview – This page provides general information about the device. Some highlights include the IP address, OS, vendor, model, agent version, and more.
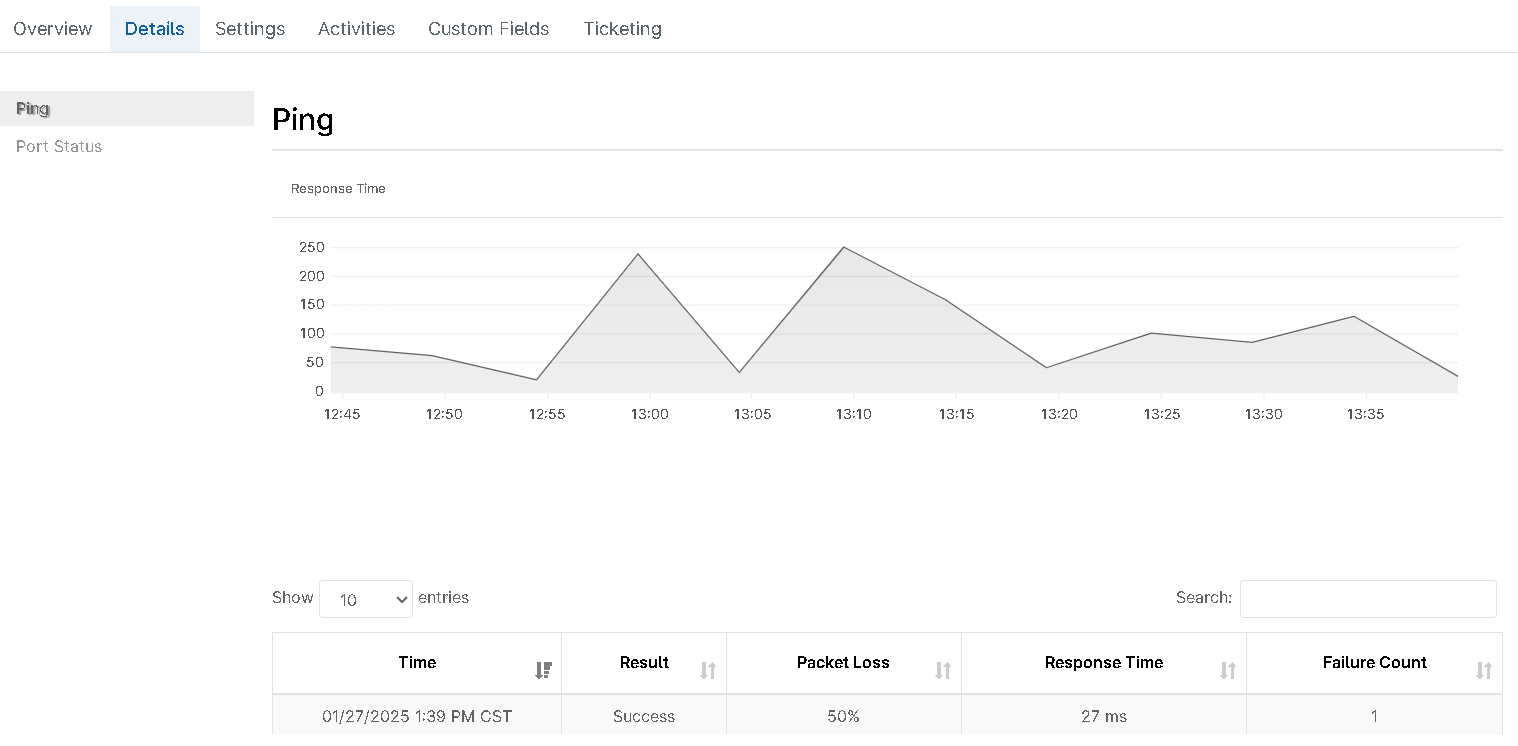
Details – The Details tab provides real-time information about the device, such as network adapters, port mapping, ping, and port status.
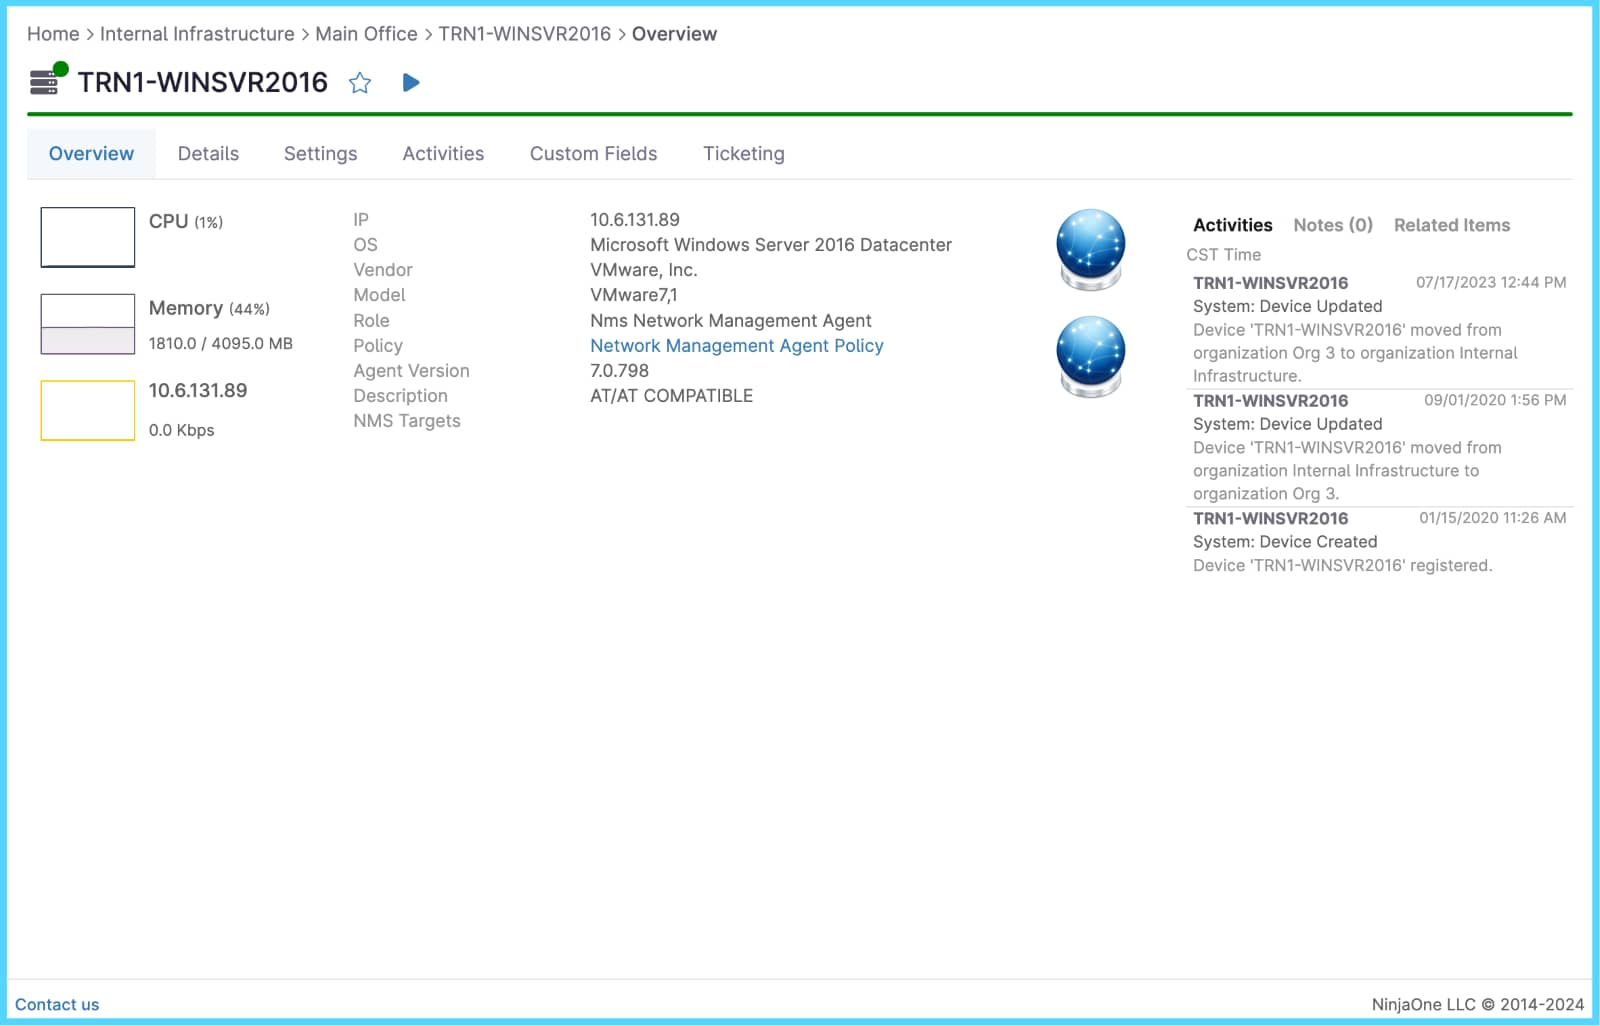
Settings – The Settings tab displays the device name, assigned user, organization, and policy assignments.
Activities – This tab provides a list of all activities that have occurred for this device.
Custom Fields – Displays any global or role-specific custom fields available for this device.
Benefits of using NinjaOne for Switch Monitoring
- Centralized Monitoring: NinjaOne allows you to monitor all of your network devices, including switches, from a single, unified dashboard, making it easier to track performance and detect issues.
- Real-Time Alerts: You can set up real-time alerts for various parameters (such as port status or network performance), ensuring immediate attention when problems arise.
- Performance Metrics: NinjaOne provides detailed performance data like bandwidth usage, packet loss, and latency, helping you ensure your switches are operating optimally.