
VMware monitoring tools are essential for maintaining the health and performance of virtualized environments. By proactively tracking key metrics and events, administrators can identify potential issues before they impact end-users.
NinjaOne, a comprehensive endpoint management platform, offers robust VMware monitoring capabilities, enabling IT teams to streamline their monitoring workflows and ensure optimal performance of their virtual infrastructure.
How to Monitor VMware with NinjaOne
NinjaOne simplifies VMware monitoring through its intuitive interface and powerful features. Here’s how to get started:
Setting up VMware monitoring
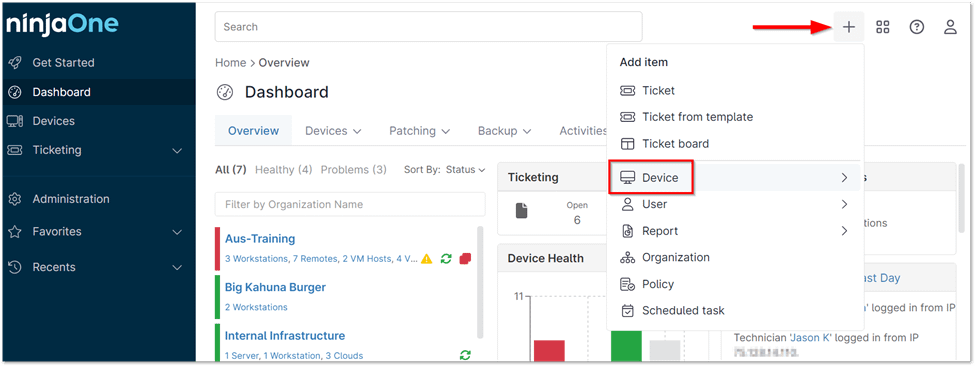
1. Click the plus sign icon at the top of the Ninja console and select Device from the drop-down menu, then select Virtual Infrastructure to begin setup.
2. Click VMware ESXi on the left side of the host creator and select an organization to activate the other required fields.
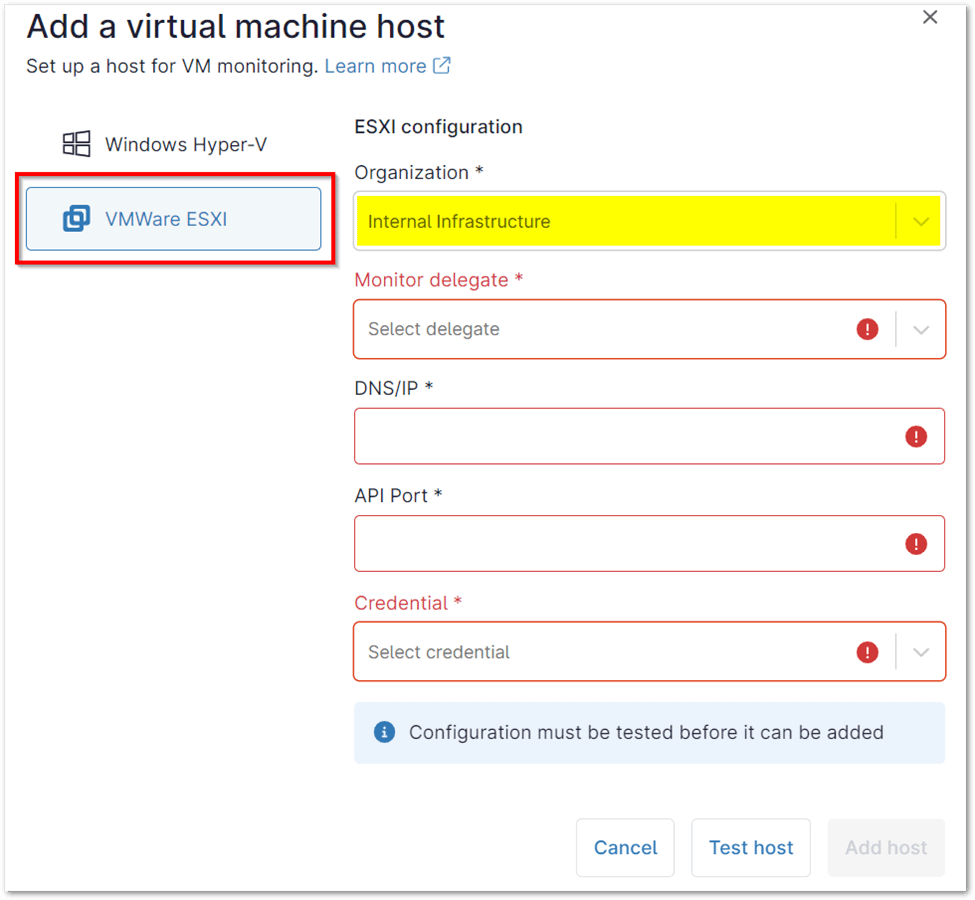
3. Specify the DNS or IP address, the API port (typically 443), and provide the credentials for an admin account to enable access.
Testing the Monitor Delegate
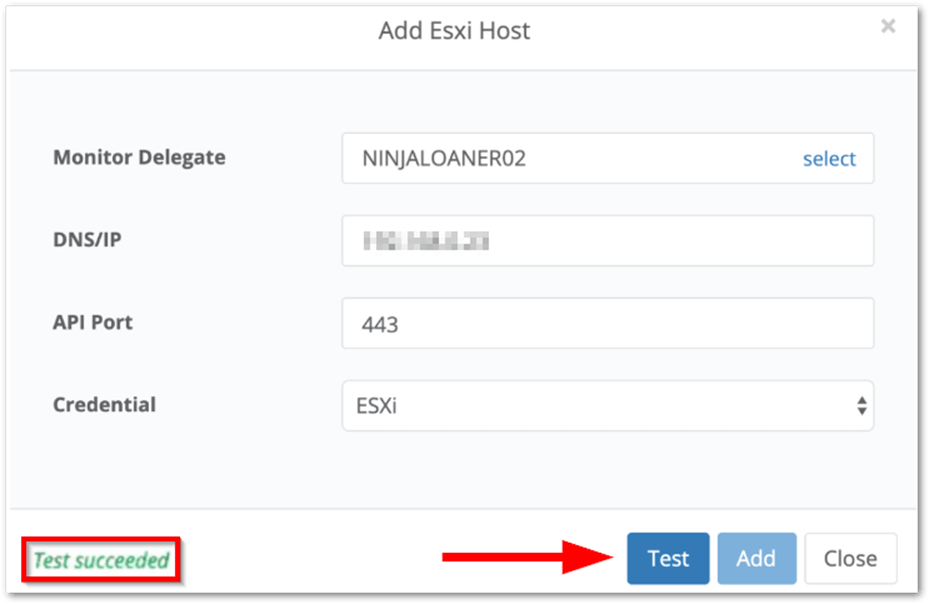
1. Click Test to confirm your configuration is accurate. A success message in green will appear in the bottom left corner if the test passes. If not, a failure reason in red will be displayed in the same area.
2. If the test is successful, click Add in the bottom right corner.
3. Once the host has been added, click Save in the top right corner to finalize the setup.
VMware Hosts and Guests in NinjaOne
After successfully adding a host, it will appear in NinjaOne with four main tabs for navigation: Overview, Details, Settings, and VM List. Guests, on the other hand, offer three tabs: Overview, Details, and Settings.
Overview Tab
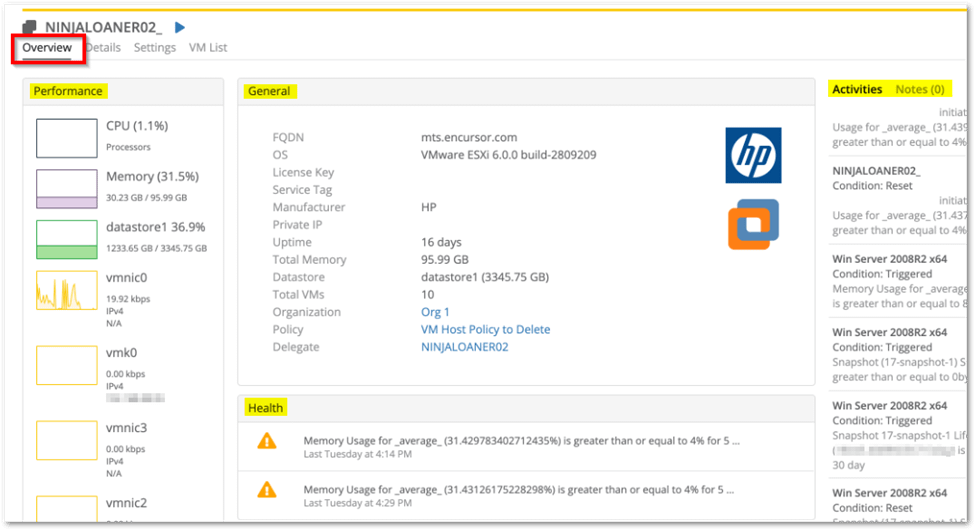
The Overview tab primarily consists of three sections: Performance, General, and Activities/Notes. Additionally, a fourth section called Health may appear at the bottom if any conditions are triggered on the device.
- Performance: Provides graphs that indicate the recent performance of the device’s CPU, memory, datastore, and network adapter(s).
- General (for VMware Hosts): Provides the following information about the device: FQDN, OS, license key, service tag, manufacturer, private IP, uptime, total memory, datastore, total VMs, organization, policy, and delegate. The organization, policy, and delegate values provide a hyperlink to each respective item in NinjaOne.
- General (for VMware Guests): Displays essential information about the guest virtual machine, including its operating system, vCPU and core allocation, private IP and MAC address, snapshot count, creation date, guest tools status, and its associated organization, policy, and VM host. These latter three items are hyperlinked for convenient access within NinjaOne.
- Activities/Notes: Provides the activity feed for the device or, when Notes is selected, displays the current device note (if any).
- Health: This section appears if there are currently any conditions triggered on the device. It will not be visible if the device is healthy.
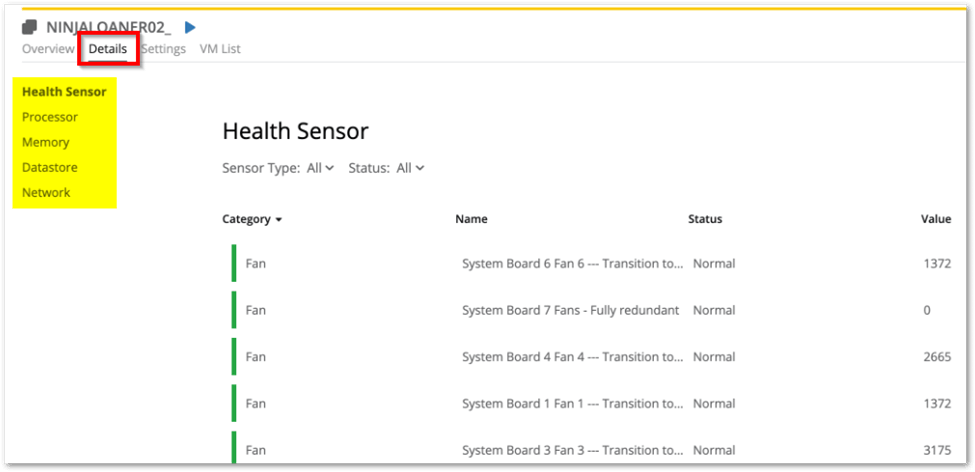
Details Tab
The Details tab provides in-depth information with five main sections for VMware hosts (Health Sensor, Processor, Memory, Datastore, and Network) and six sections for VMware guests (Processor, Memory, Datastore, Network, Guest Tools, and Snapshot).
- Health Sensor: Provides sensor data directly from ESXi. You can sort by specific sensor type(s) and/or status(es), or sort by category, name, status, or value. (Host only)
- Processor: Provides information about the processor and CPU utilization. For hosts, it includes details like the number of cores, threads, and CPU speed. For guests, it shows the number of CPUs and their speed.
- Memory: Provides information about the memory usage on the device. For hosts, it includes the amount of memory in use, the total amount, and the amount available.
- Datastore: Provides information about the datastore on the device, such as the read and write speeds. (Host only)
- Network: Provides graphs of the throughput for each network adapter.
- Guest Tools: Provides information regarding whether or not Guest Tools is installed, what version is installed, whether it is running, and whether the version running is the latest. (Guest only)
- Snapshot: Provides a list of all snapshots that have been taken of the virtual machine. You’ll be able to see when the snapshot was created and its size. To delete a snapshot, click on it and then click the Delete button that appears at the top of the list. To create a new snapshot, click Create at the top of the list. (Guest only)
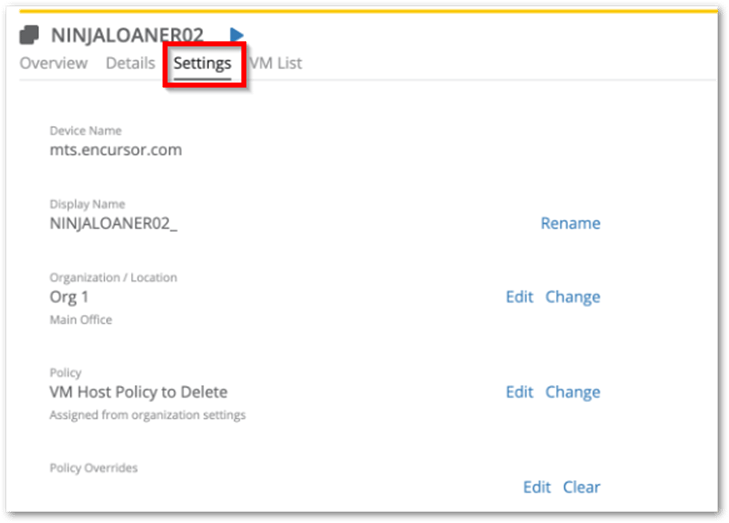
Settings Tab
The Settings tab allows you to manage various aspects of the device configuration:
- View the device name/FQDN: See the device’s fully qualified domain name (for hosts) or its simple name (for guests).
- View or edit the display name: Change how the device is identified in the NinjaOne console.
- View/edit the organization and location: Assign or change the organizational structure and physical location associated with the device.
- View/edit/change the policy: Manage the policy applied to the device to control monitoring, automation, and other settings.
- Edit or clear any device-level policy overrides: Customize specific settings for the device, overriding the default policy behavior if necessary.
VM List Tab
This tab, available only for hosts, displays all virtual machines associated with it. You can filter this list by operating system and/or state, or sort it by various criteria such as name, OS, state, vCPU, cores, memory, storage utilization, MAC address, or VMware Tools status.
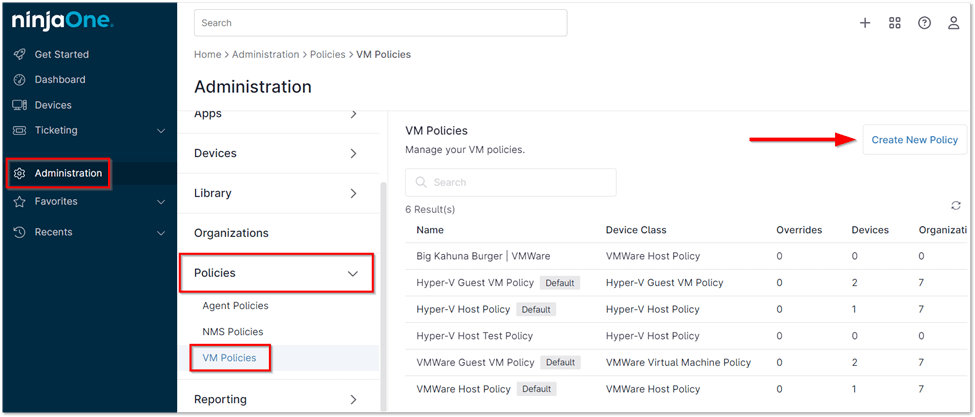
Creating Policies for VMware Monitoring
NinjaOne now offers two new types of policies tailored for VMware monitoring: VMware Host policies and VMware Guest VM policies. Host policies are designed specifically for monitoring ESXi hosts, whereas guest policies focus on monitoring the virtual machines running on a host. The following steps outline the process of setting up these VMware policies:
1. Navigate to the Policies section within the Administration area in the left navigation pane and select VM Policies.
2. Click on Create New Policy located on the right side of the page.
3. Provide a name for your new policy (required) and an optional description. Then, assign the appropriate role to the policy: either a VMware Virtual Machine or a VMware Host.
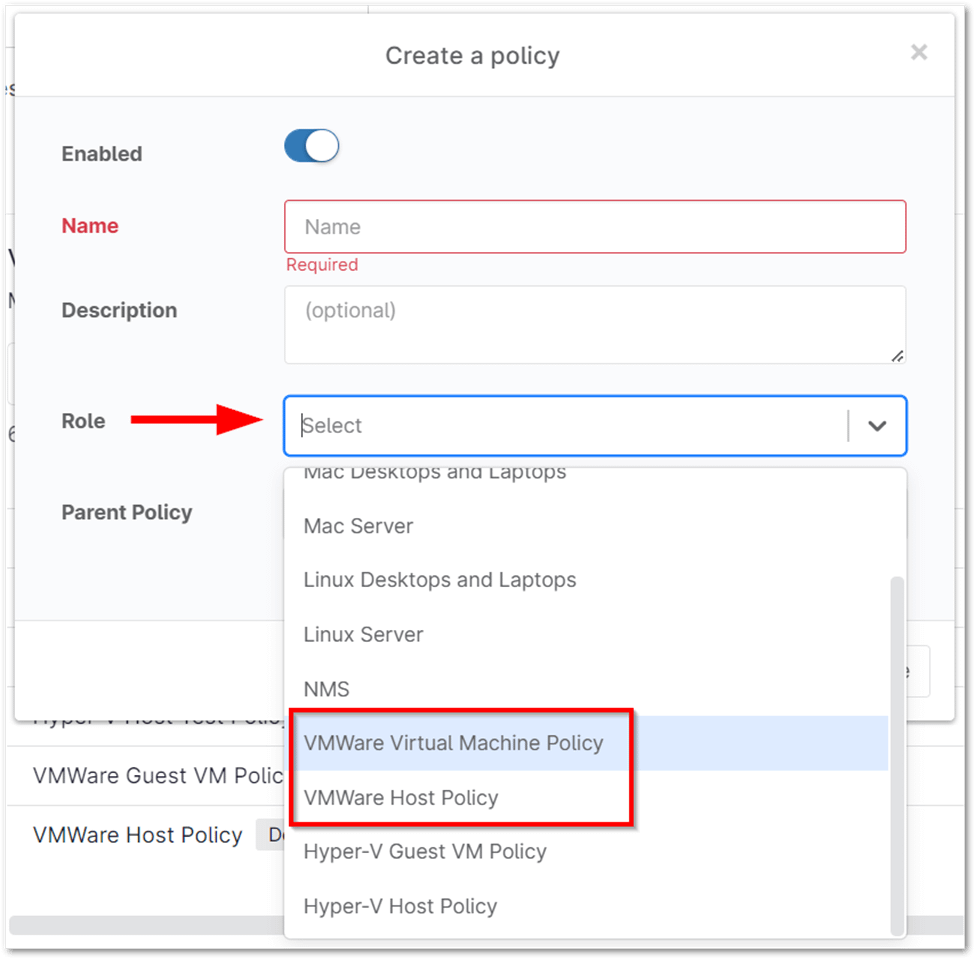
4. Choose whether to assign a parent policy to your new policy. If you do, the new policy will inherit all existing settings from the parent, and any changes made to the parent will also affect the child policy. However, you can override certain settings on the child policy.
5. Click Save in the bottom right corner to create your new policy.
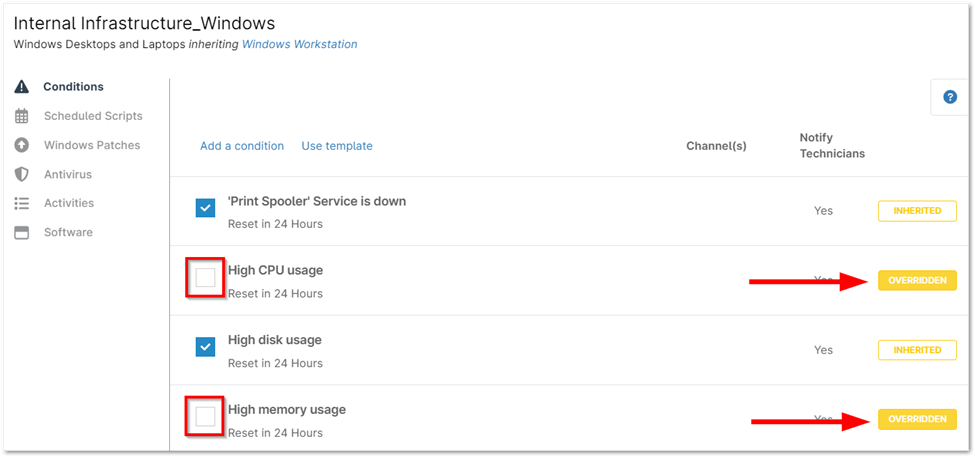
6. By default, a new VMware policy will include several pre-configured conditions. You can add more conditions to your policy by clicking on “Add a condition” in the top right corner. Remember to save your policy after adding conditions.
Key Advantages & Strategies for VMware Monitoring with NinjaOne:
- Unified Monitoring and Management: NinjaOne centralizes VMware monitoring, management, and remediation tasks, enhancing efficiency and streamlining your IT toolkit.
- Proactive Issue Resolution through Automation: Automate routine tasks and leverage monitoring and alerting features to proactively identify and resolve potential issues before they impact end-users.
- Scalable Monitoring and Performance Optimization: NinjaOne’s cloud-native architecture ensures seamless scalability as your VMware environment grows. Focus on key metrics, customize alerts, and analyze historical data to optimize performance.
- Data-Driven Insights for Planning and Compliance: Leverage NinjaOne’s dashboards and reports to gain insights into resource utilization trends, enabling effective capacity planning, troubleshooting, and compliance reporting.
Use Cases for Implementing NinjaOne in VMware Monitoring
- Capacity Planning: Track resource utilization trends to identify capacity constraints and plan for future growth.
- Performance Optimization: Identify performance bottlenecks and take corrective action to ensure optimal performance of your virtual infrastructure.
- Troubleshooting: Analyze historical performance data to diagnose and resolve issues quickly.