
SQL Server monitoring is essential for ensuring optimal performance and stability. Effective monitoring involves tracking key metrics such as resource utilization, database health, disk latency, and service status. While there are various ways to monitor SQL Server performance, NinjaOne simplifies the process by offering a streamlined solution.
With NinjaOne, you can monitor the core aspects of SQL Server, such as database services, disk space, and disk latency. These are critical for identifying issues early, such as service failures, insufficient storage, or disk performance degradation, that could affect database availability and performance.
In this guide, we’ll walk you through how NinjaOne enables you to monitor SQL Server’s vital components and why it’s a beneficial tool for managing your database environment.
How to Monitor SQL Server Performance with NinjaOne
Monitoring SQL Server’s performance with NinjaOne is straightforward and highly automated, making it easier for system administrators to track and optimize SQL Server health. Here’s how you can monitor SQL Server using NinjaOne:
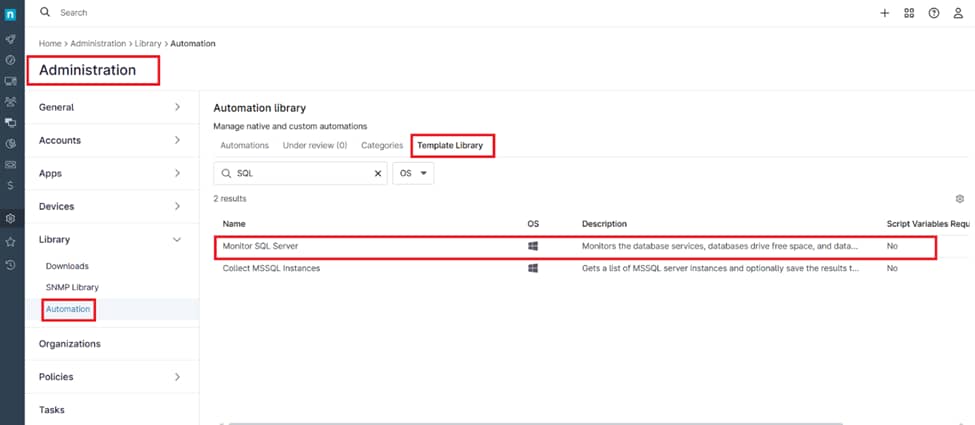
1. Navigate to Administration > Library > Automation > Template Library, then search for the Monitor SQL Server script.
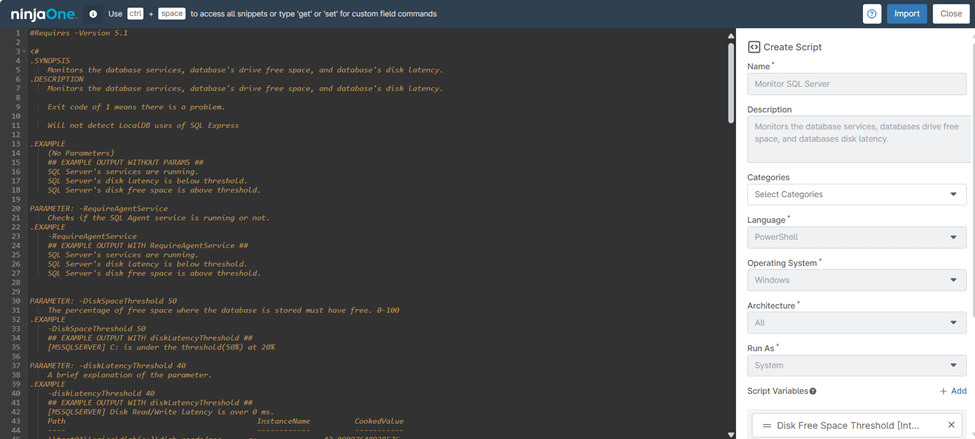
2. Click on the script, then select Import to add it to your automation library. After importing, click Save, then Close. By default, the Disk Space Threshold is set to 10%, and the Disk Latency Threshold is set to 50 ms.
Important: Review and thoroughly test all imported automations in a non-production environment before deploying them to production. Automation templates are provided as-is, and NinjaOne currently does not support modifications.
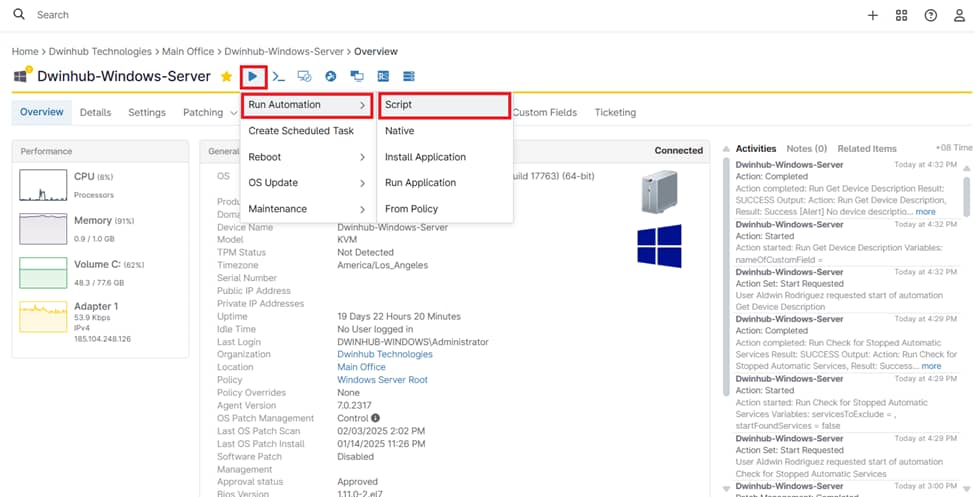
3. After the import, go to your SQL Server’s device dashboard. Click Run Automation > Script.
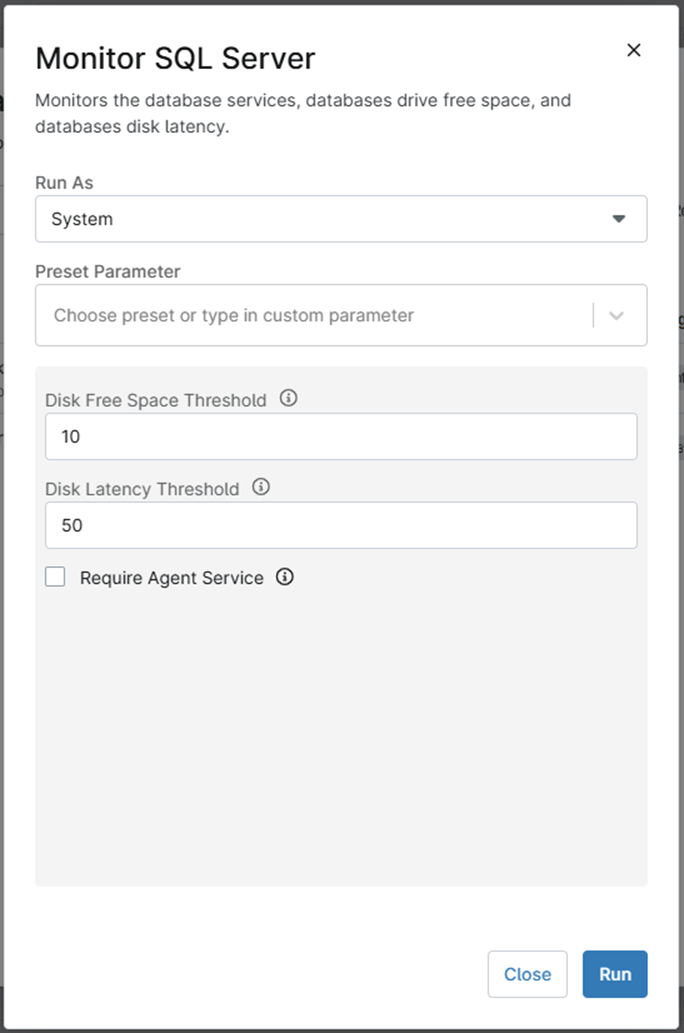
4. Search for Monitor SQL Server, select the script, and choose the desired execution context:
- System
- Current Logged-in User
- Preferred Windows Local Admin
- Preferred Windows Domain Admin
You can also configure the Disk Free Space Threshold (%) and Disk Latency Threshold (ms) before running the script.
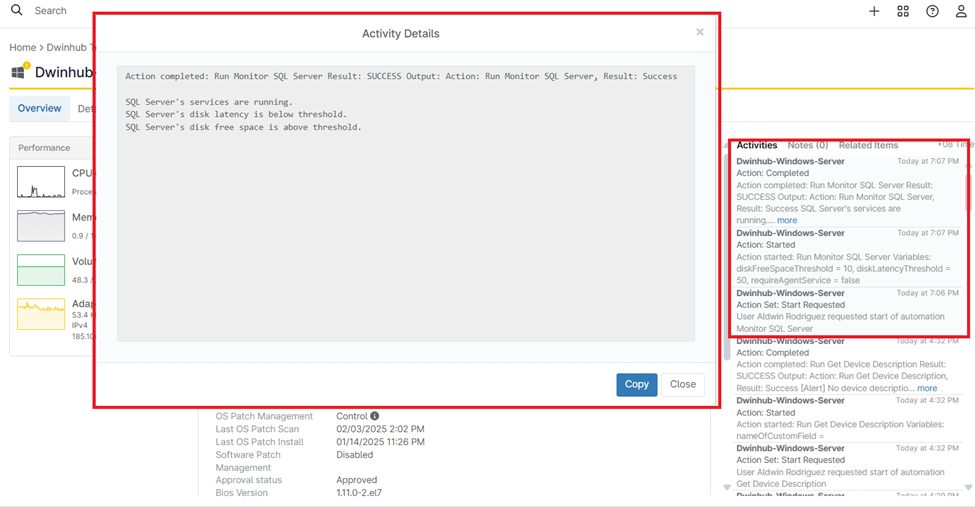
5. Once executed, the script’s output will be displayed in the Activities section.
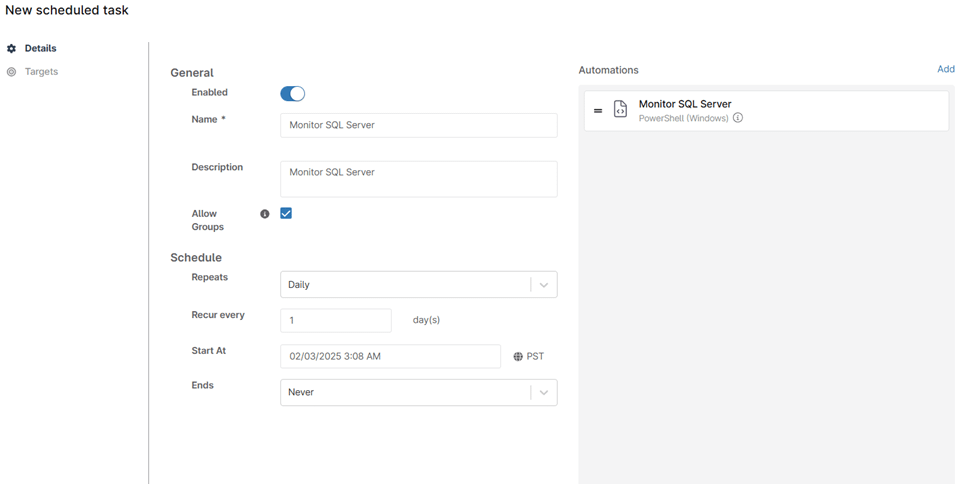
6. To automate SQL Server monitoring, you can also schedule this script to run at defined intervals. When scheduling, you can also tweak the various variables, such as disk space and latency thresholds.
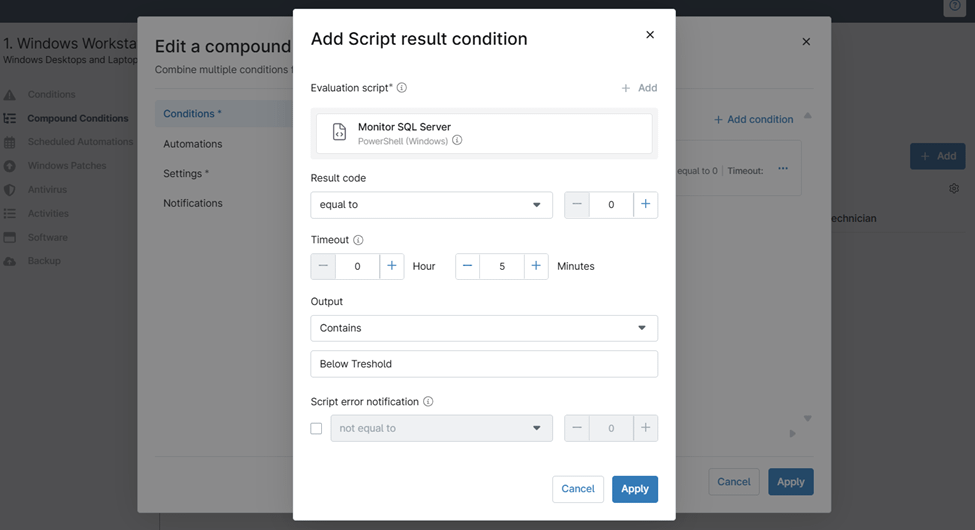
7. Additionally, you can create compound conditions to trigger automated actions based on specific criteria, such as threshold breaches. This allows you to automate responses, generate alerts, and notify technicians proactively when performance issues are detected.
The Benefits of Using NinjaOne for SQL Server Monitoring
NinjaOne offers significant advantages for SQL Server monitoring. Here’s why you should consider using NinjaOne for your database infrastructure:
- Centralized Monitoring and Management
With NinjaOne, you can manage all of your SQL Server instances from a single platform. This centralized approach streamlines monitoring tasks, providing real-time updates and alerts for any performance issue without needing to log into each individual server. - Ease of Use
NinjaOne’s user interface is intuitive and designed to minimize complexity. Even users without deep database administration experience can easily access critical performance data and respond to issues quickly. - Scalability
NinjaOne can scale with your environment, making it suitable for managing both small and large database infrastructures. As your SQL Server environment grows, NinjaOne ensures you maintain visibility and control over all your instances.
SQL Server Activity Monitor vs. SQL Monitoring Tools
The main difference between the SQL Server Activity Monitor and SQL monitoring tools is the depth and scope of monitoring capabilities. Activity Monitor is a built-in feature in SSMS that provides real-time insights into server performance, such as active sessions, resource usage, and running queries. It’s useful for quick, on-the-spot diagnostics.
In contrast, SQL monitoring tools offer advanced features like historical performance tracking, custom alerts, automated reporting, query optimization analysis, and proactive issue detection. These tools are designed for continuous monitoring and long-term performance management across multiple servers and complex environments.