
About Troubleshoot Windows Patches
Patching is essential to keep a managed network secure. Most cyberattacks exploit known vulnerabilities in software, and timely patching effectively closes those gaps, preventing potential breaches. However, the patching process is not always smooth, and troubleshooting becomes crucial when things go wrong. For instance, a patch might fail to install correctly due to software conflicts, insufficient disk space, or corrupted files.
Sometimes, patches can cause system instability or compatibility issues with other applications, leading to crashes or degraded performance. In such cases, understanding how to troubleshoot patching issues is vital to quickly restoring functionality and maintaining the security integrity of the network. Regular patching, coupled with effective troubleshooting, ensures that systems are both up-to-date and reliable, minimizing the risk of exploitation while maintaining operational efficiency.
How to Troubleshoot Windows Patches in NinjaOne?
Troubleshooting Windows patching is a complex task that requires the expertise of experienced system administrators. This document is not intended to replace the skills and knowledge of these professionals; rather, it explains how NinjaOne’s integrated tools can assist in the troubleshooting process.
Most of the reasons why a Windows patch may fail to install are well-known, including low disk space, a pending system reboot, multiple updates queued, corrupted system files, malfunctioning Windows Update Service, and others that can be identified by checking the log files. We will explain how NinjaOne can help check these common causes.
What You Should Know About NinjaOne’s Patching Capabilities
NinjaOne is not a patching solution like WSUS or SCCM. Instead of scanning and distributing patches across the managed network, NinjaOne manages the endpoint patching engine and configures it uniformly across all endpoints based on your configuration preferences.
When troubleshooting patching issues, it is important to understand that NinjaOne’s role is to enforce your patching settings through policies, rather than distribute patches. If patches are not being applied as expected, focus on verifying the configuration settings within NinjaOne and ensuring that the endpoints’ patching engines are functioning correctly.
How Can I Use NinjaOne’s Integrated Tools to Troubleshoot Patching Problems?
Let’s explore the different tools NinjaOne offers to assist in the patching troubleshooting process.
1. Inventory Alerts
The first tool to identify patching problems is Inventory Alerts. When there´s a patching problem, it can be identified by looking at the System dashboard. Just click Dashboard in the main screen and you will have an overview of the entire system, in this dashboard, you can see what are called Dashboard Inventory Alerts, which are colored icons indicating problems. This icon: ![]() , indicates a patching problem. By hovering the mouse over this icon, you can get more information, let’s see an example in the screenshot below:
, indicates a patching problem. By hovering the mouse over this icon, you can get more information, let’s see an example in the screenshot below:
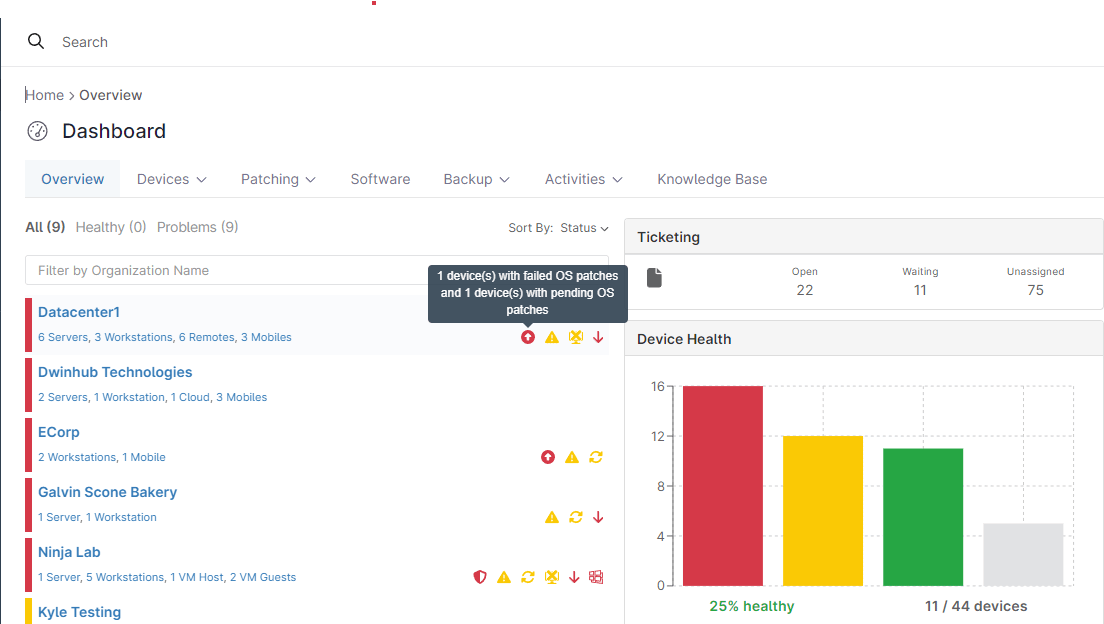
This example shows that there is one device with failed OS patches and 1 device with pending OS patches, however it doesn’t give more details. To get more details, you can click the ![]() icon, see the results below:
icon, see the results below:
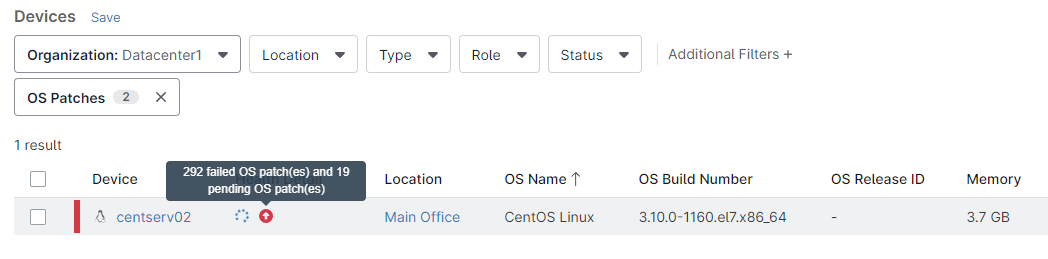
Here, we can see that server centserv02 has 292 failed OS patches and 19 pending OS patches.
By clicking the ![]() icon again, we can see even more details, including the patch names and when they failed to install. See below screenshot for details:
icon again, we can see even more details, including the patch names and when they failed to install. See below screenshot for details:
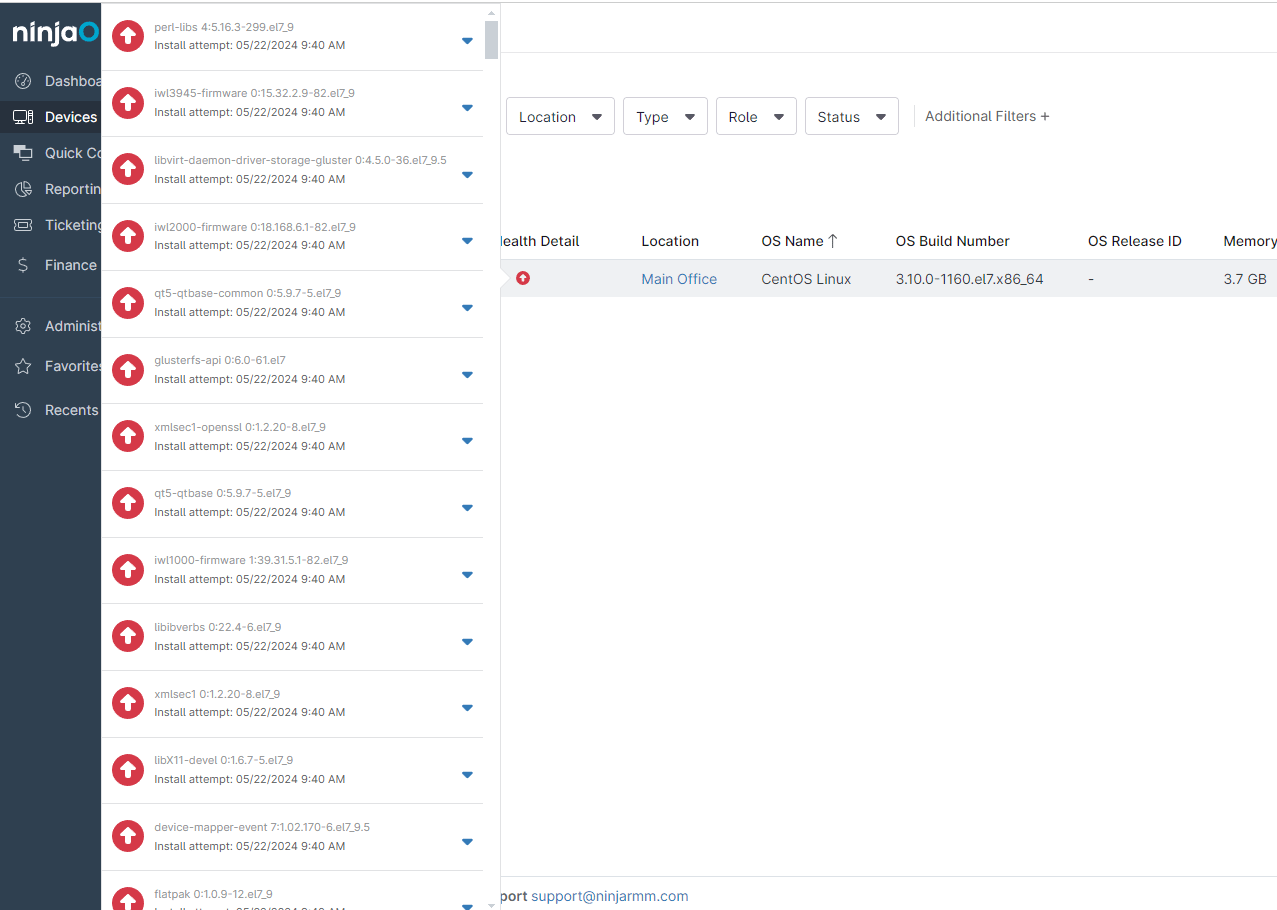
Once the problematic endpoint has been identified, the technician can start the troubleshooting process.
Sometimes the same icon can be yellow colored: ![]() , this means a patching issue, but with something that is non-critical, like an optional patch.
, this means a patching issue, but with something that is non-critical, like an optional patch.
2. The Patching menu
On the Device Overview page, there is a Patching menu with different actions that can help in finding patch issues. Using this menu, you can check the status of all applicable patches for a particular endpoint. To access this menu, follow the instructions below:
a) Click the target endpoint from the device dashboard, at this moment, the screen changes to show the endpoint details.
b) Hover over Patching and select OS patches. You will see a drop-down menu with the following options: Pending, Approved, Rejected, Installed and Failed.
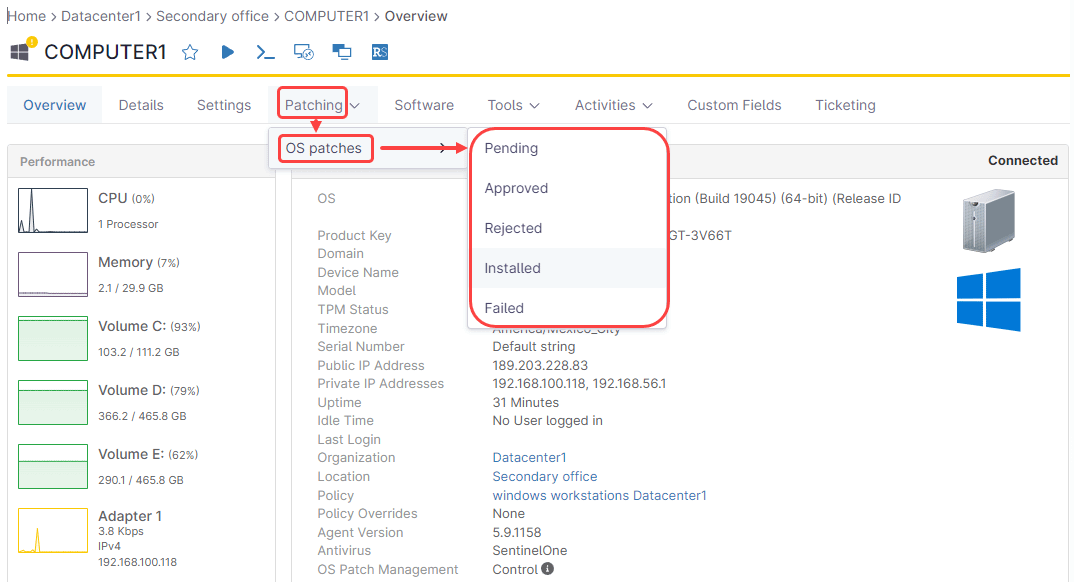
Any patch not listed as Installed requires investigation.
When you enter the Installed option, you will see the list of all the patches installed on the selected endpoint, sorted by installation date. If the most recent installation date is older than a week, this requires investigation.
3. Manual patching
In NinjaOne, it is possible to trigger an off-hour patching cycle, this is useful after some troubleshooting work has been done and we want to verify the patching functionality of the endpoint. Follow the next instructions to perform this process:
a) Click the target endpoint from the device dashboard, at this moment, the screen changes to see the endpoint details.
b) Hover the mouse over the play icon (![]() ) next to the endpoint´s name, this action will display a drop-down menu.
) next to the endpoint´s name, this action will display a drop-down menu.
c) Hover over OS Update.
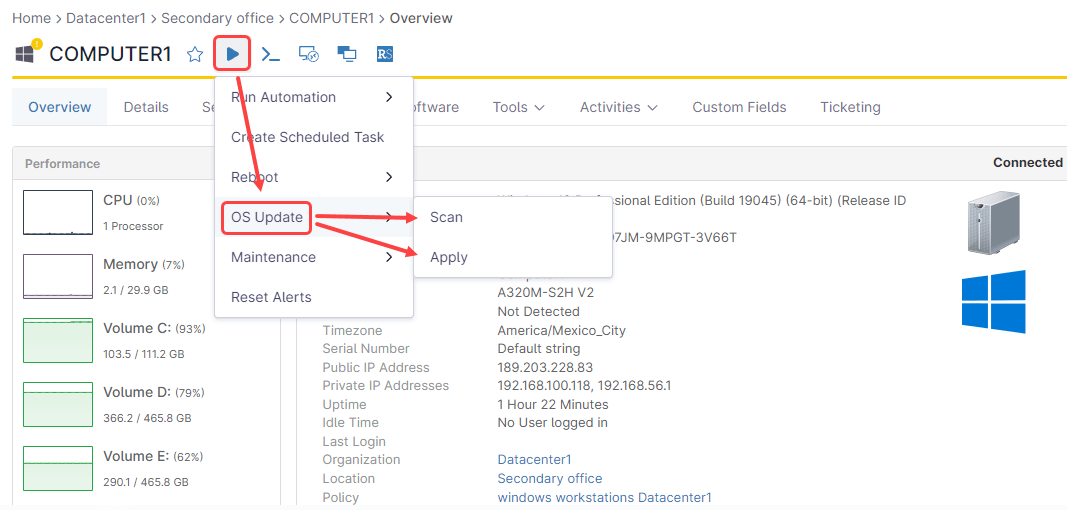
d) Select Scan to force the endpoint to start a patch scan. If patches are found, they will appear as Pending or approved (see previous section, #2 Patching Menu).
e) Select Apply to force the endpoint to install the pending and approved patches.
4. File Browser
Another useful tool is the File Browser. File Explorer allows you to navigate the drives on the endpoint to view, copy, and paste files to or from the endpoint. For example, you can use the File Browser to access the endpoint’s C: drive, go to the C:WindowsLogsWindowsUpdate folder, fetch the log files to your machine, and analyze them locally. These log files are used by Windows Update to track its events.
To access the file browser,
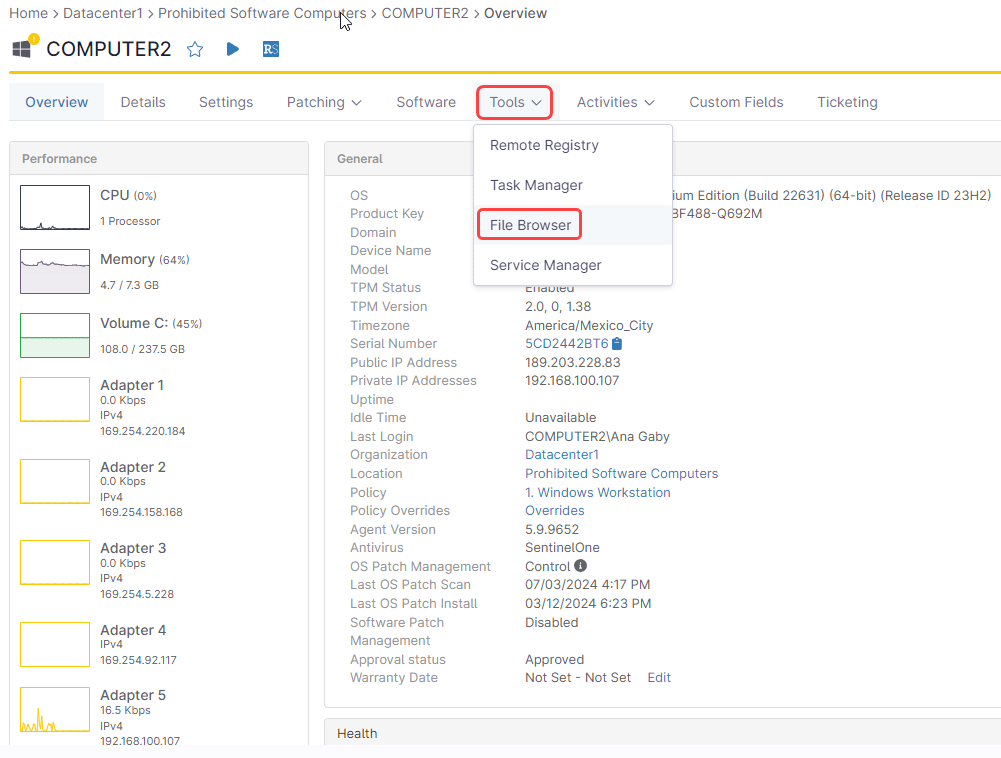
a) Click the target endpoint from the device dashboard, the screen changes to show the endpoint details.
b) Hover over Tools and then select File Browser.
c) Hovering the mouse over the play icon will display a drop-down menu.
d) You will be taken to a screen showing the device’s storage structure, which you can browse until finding the needed files. Once located, select them using the checkbox on the left side and then you can download them to your computer. (you can also delete and rename files). There´s an action menu on the right side of the page. When multiple files are selected, instead of Download, the Compress option is shown, this is to save bandwidth when downloading files. The compressed file can then be downloaded to your computer.
You can also use the file browser to delete unused files to make room on the C drive when lack of disk space prevents patches from being installed.
5. Remote Service Manager
The Remote Service Manager is another useful tool when troubleshooting Windows Patches.
With the Remote Service Manager, you can view, start, stop, or restart, and even change the startup type of a Windows endpoint´ service,
Restarting the Windows Update service is a common task during the patch troubleshooting process, you can do this by following these steps:
a) From the Device Dashboard, click the target endpoint. the screen changes to show the endpoint details.
b) Click Tools.
c) Select Service Manager from the drop-down menu. The Windows services list should become visible within a few seconds.
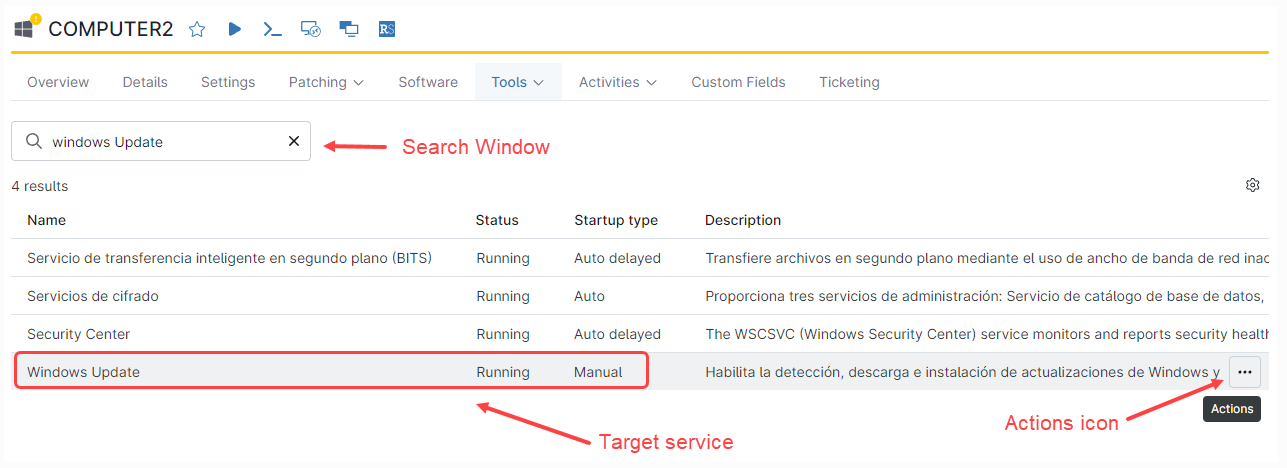
d) Under the search window, type “Windows Update,” this narrows down the service list and the Windows Update service will be visible, along with its status, startup type and description.
e) Hover the mouse over the service name and the actions icon (![]() ) will appear on the right of the service´s description, by hovering the mouse over it, an “Actions” label will appear (See below screenshot for reference).
) will appear on the right of the service´s description, by hovering the mouse over it, an “Actions” label will appear (See below screenshot for reference).
f) Click the actions icon and select Restart from the drop-down menu.
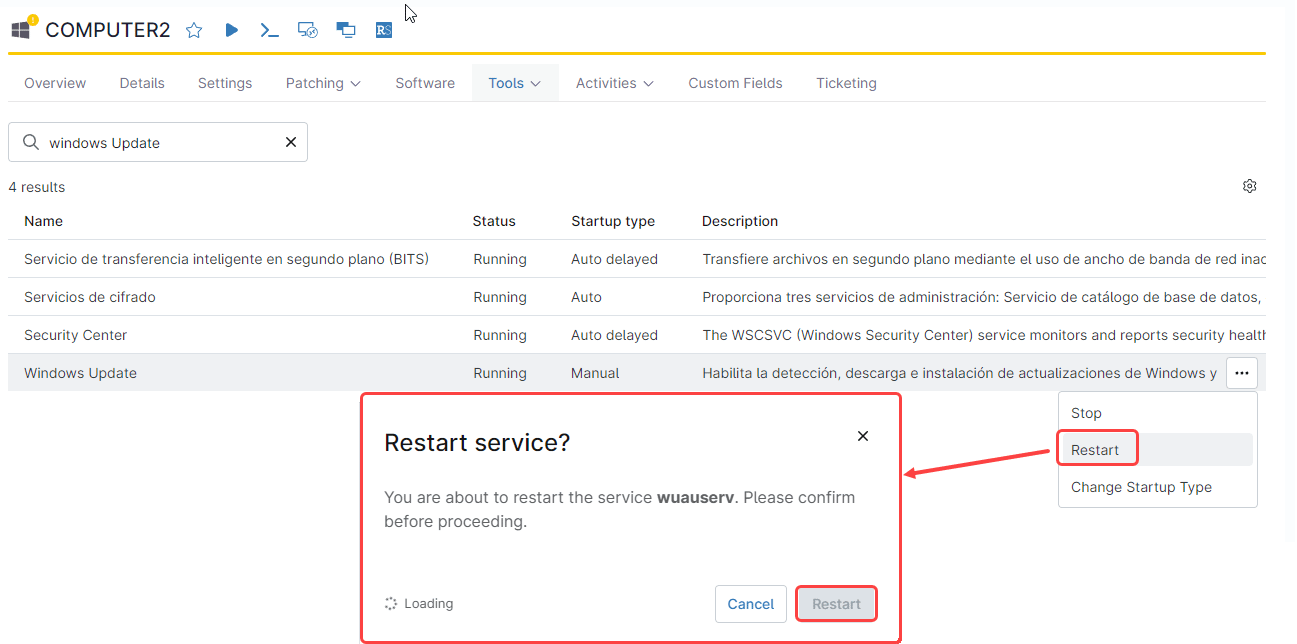
g) In the pop-up Window, confirm by clicking Restart.
h) Wait until the pop-up Window disappears, this is the indicator that the action was completed.
6. Remote Reboot
The remote reboot tool is another useful one. System Administrators know that pending reboots are sometimes the cause of a patching issue, and a simple reboot solves the problem.
There are several ways to send a system reboot request to an endpoint. Follow the next steps to explore these methods.
-
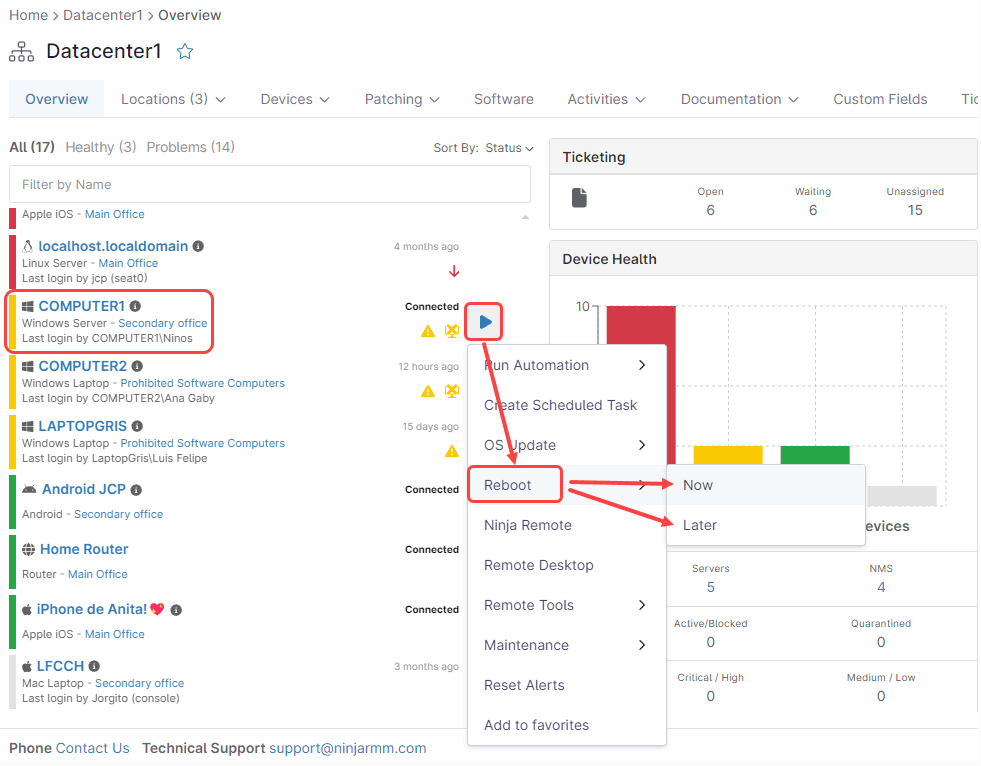
From the Organization Dashboard
a) Click Dashboard and then Click on your organization.
b) Identify the endpoint you want to reboot and hover the mouse over it. A play icon (![]() ) will appear.
) will appear.
c) Hovering the mouse over the play icon will display a drop-down menu. From the different options, select Reboot, and then select Now, or Later (if the reboot option doesn’t appear, there might be a communication issue with the endpoint).
d) If instead of Now, you select later, a pop-up windows will appear to define the reboot schedule.
-
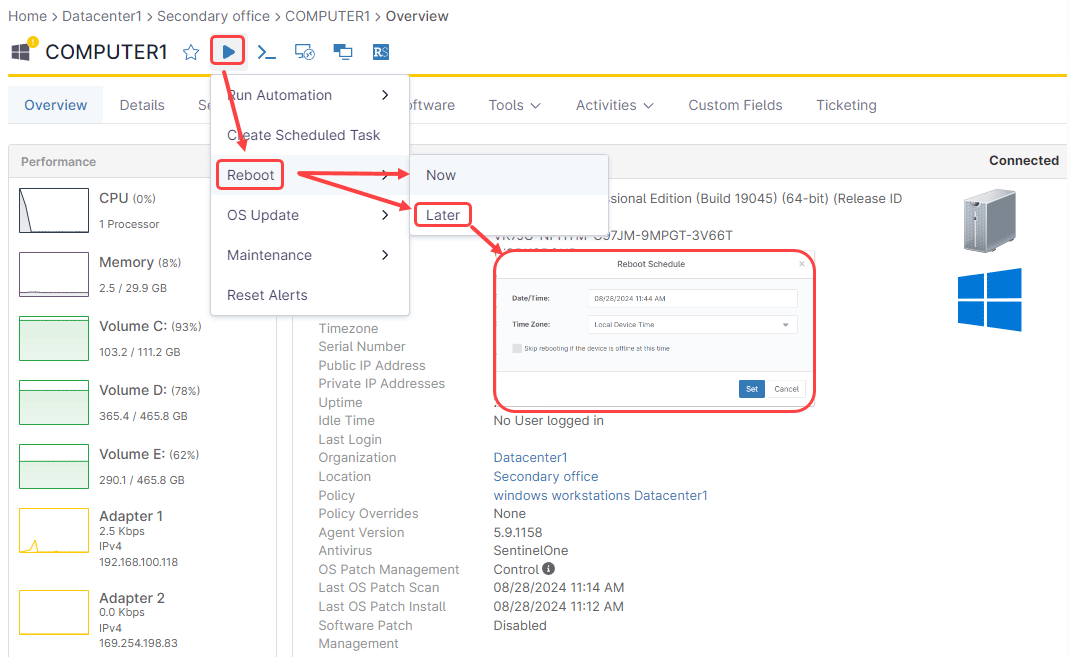
From the endpoint overview page
a) From the Device Dashboard or from the Organization Dashboard, identify the target endpoint and click on it. The Endpoint overview page will be displayed.
b) Hover the mouse over the play icon ( ![]() ) next to the endpoint´s name.
) next to the endpoint´s name.
c) Hovering the mouse over the play icon will display a drop-down menu. Select Reboot, and then select Now, or Later (if the reboot option doesn’t appear, there might be a communication issue with the endpoint).
d) If instead of Now, you select Later, a pop-up windows will appear to define the reboot schedule.
-
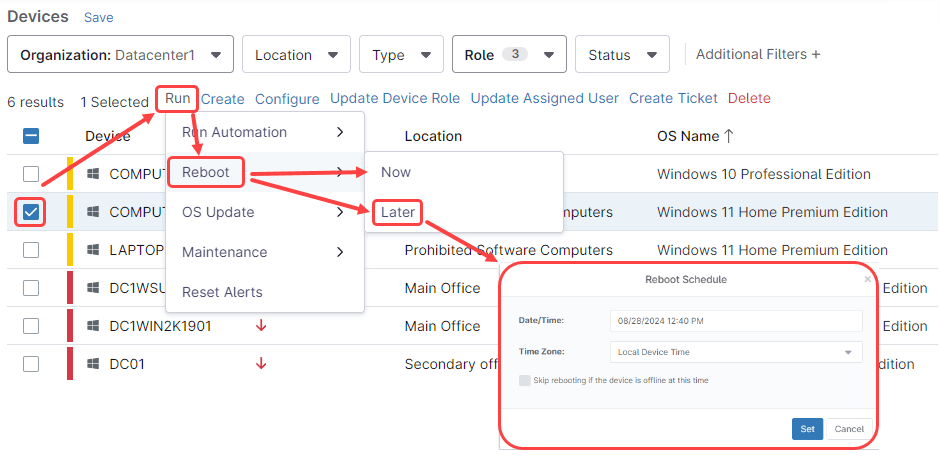
From the Device Dashboard
a) From the Device Dashboard identify the target endpoint(s) and select it (or multiple devices) by checking the box to the left of the device name.
At this point, a blue option ribbon will appear above the device list.
b) Hover over Run, from the ribbon options.
c) From the drop-down, select Reboot, and then select Now, or Later (if the reboot option doesn’t appear, there might be a communication issue with the endpoint).
d) If instead of Now, you select Later, a pop-up window will appear to define the reboot schedule.
7. Command prompt (Cmd.exe or PowerShell)
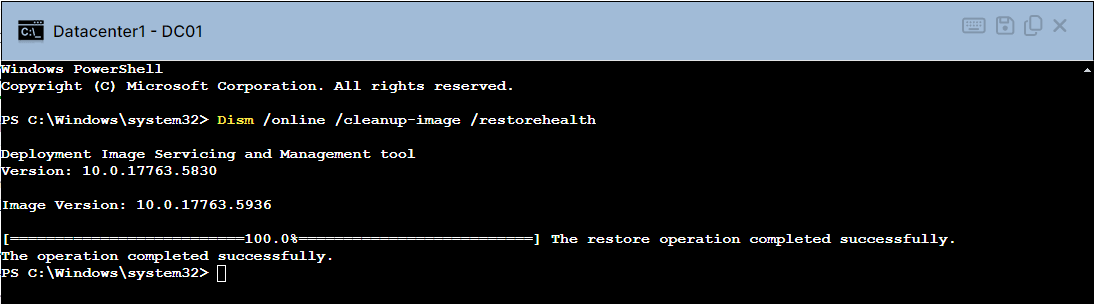
Using the command prompt on the remote Windows endpoint can help troubleshoot windows patch issues. Let’s illustrate this with an example: Windows provides the following command to scan and fix damaged Windows Update images: Dism /online /cleanup-image /restorehealth. If you suspect a corrupted patch file, you can run this command and fix it.
Follow the next steps to remotely run PowerShell cmdlets or executable commands in NinjaOne.
Open the Device´s overview (from any dashboard, locate the device and click on it).
Hover over the command prompt icon ( ).
From the drop-down select either Cmd.exe or PowerShell.
You have the option to run Cmd.exe or PowerShell as System, or as the logged in user. You also have the option to run at 32 or 64 bits.
a) Make your choice according to your liking. You will be asked to enter your MFA method answer.
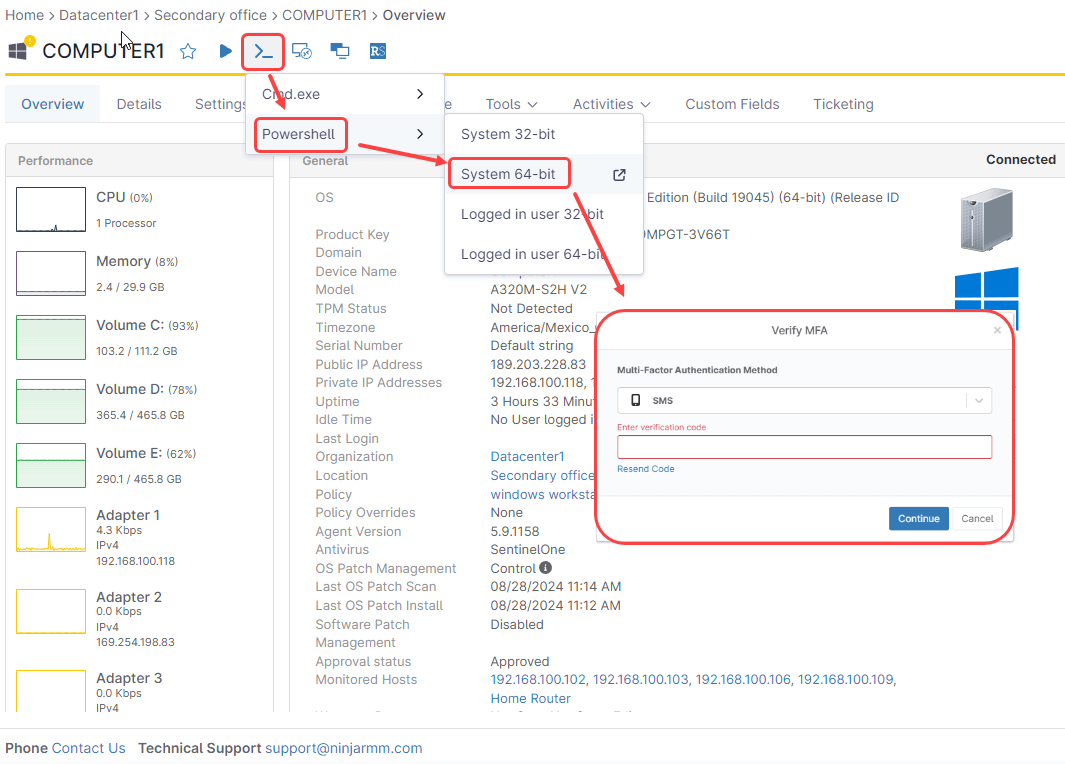
b) Once your MFA answer has been validated, a command prompt window will be presented, where you can type your commands or cmdlets, which will be run remotely on the target device.
8. Remote Desktop
Complex patch issues often require working directly on the affected computer to diagnose and resolve the problem. Remote Desktop is the best way to do this remotely, eliminating the need for an on-site visit.
NinjaOne offers various remote desktop solutions, including integrations with third-party platforms like SplashTop, TeamViewer and ConnectWise ScreenConnect as well as its own native solution, Ninja Remote.
Note that each remote desktop solutions has its own identifying icon as follows:
SplashTop: ![]()
Teamviewer: ![]()
ConnectWise: ![]()
Ninja Remote: ![]()
Follow the next steps to start a remote desktop session:
- From the Device Dashboard or from the Organization Dashboard, identify the target endpoint and click on it. The Endpoint overview page will be displayed.
- Identify the corresponding remote session icon next to the device name and click on it.
- After a few seconds and once the necessary handshaking has been performed, the remote desktop window will appear.
It is important to note that all remote desktop solutions mentioned require enabling in the Apps section. At the end of this document there are links to documents that explain how to enable these solutions.