
One of the key features of NinjaOne is its single pane of glass view, which allows you to see a large amount of information in a single view and allows you to make quick decisions to keep your IT infrastructure in optimal condition.
The NinjaOne dashboards show the ongoing inventory alerts as small icons, indicating issues that need to be looked at. Colors are used to set an alert level: green means everything is good. Yellow means needs attention and red means unhealthy.
At the right of every device or organization, depending on the dashboard you´re viewing, appears a series of colored icons showing alerts, if any. These are Dashboard Inventory Alerts.
Just hover the mouse over each icon to see what they say. See the below screenshot that illustrates the System Dashboard showing these alerts for every organization.
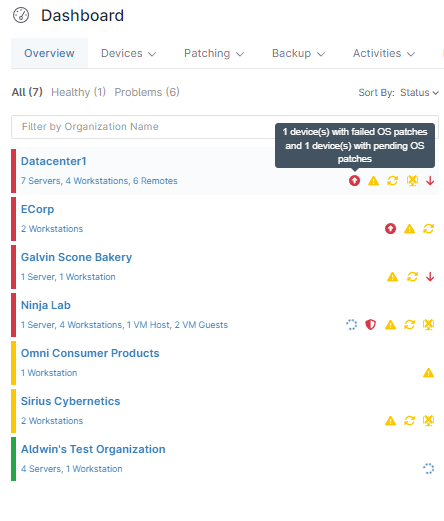
Each red or yellow icon is an inventory alert. By hovering the mouse over one of them, we can see one device that failed OS patches and one with pending OS patches.
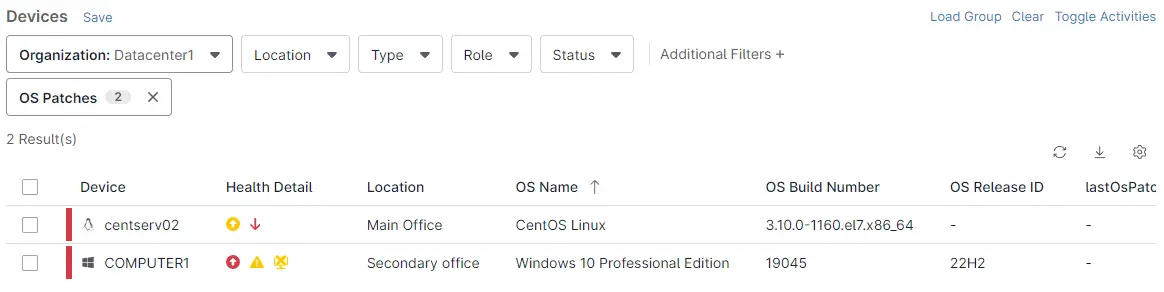
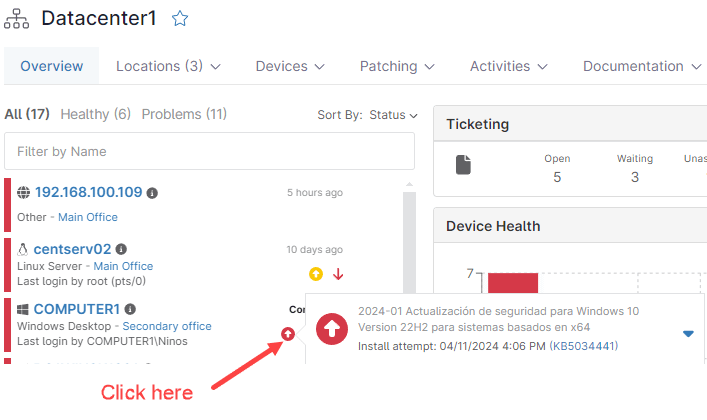
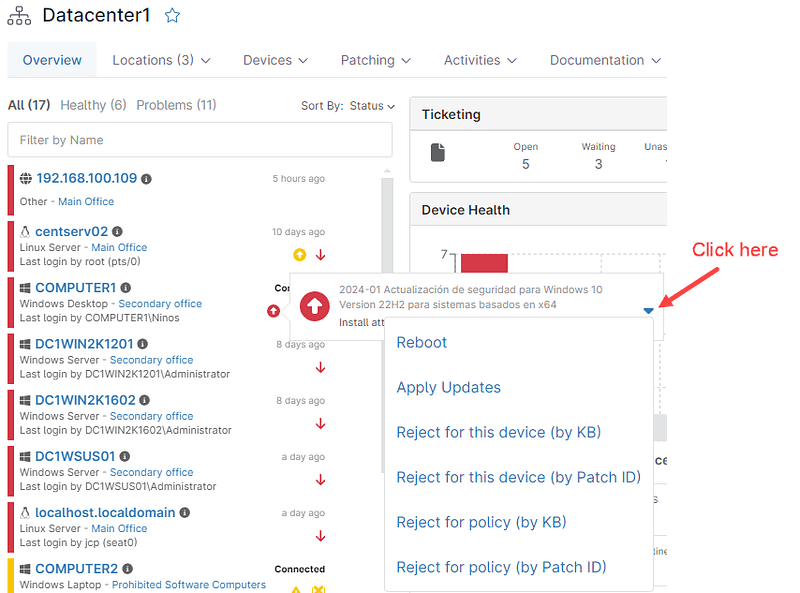
We mentioned that by hovering the mouse over the alerts, a call-out sign appears explaining the reason for the alert, but we can also click on the alert icon to get more information. For example, the next information appears by clicking the red icon on the screen above, showing the two servers with problems.
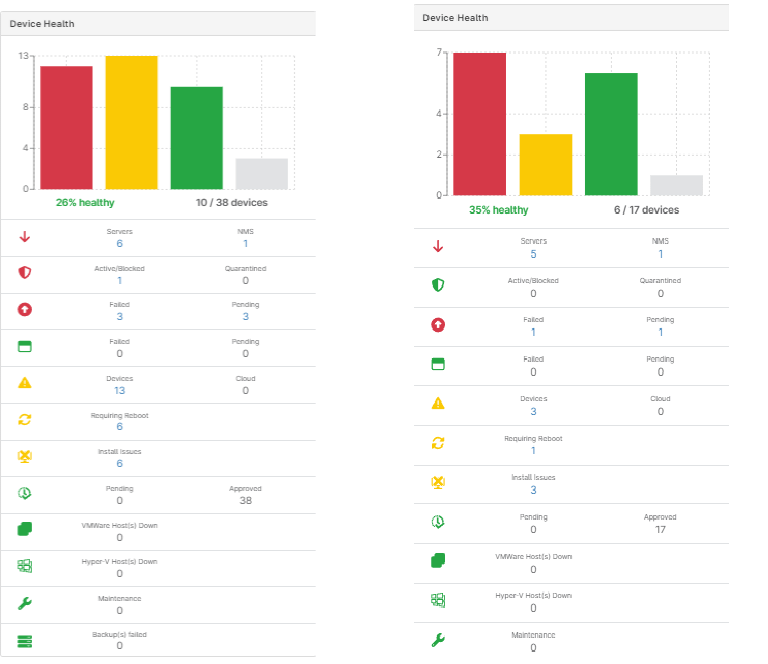
The System dashboard and the Organization Dashboard provide a device health overview with a bar graph showing the number of unhealthy, needing attention, healthy, and unknown devices. It also shows a breakdown by status. See the below screenshot showing the device health overview.
The graph on the left was taken from the System dashboard, while the graph on the right was taken from the Organization dashboard. Please note that only one of the graphs is displayed, depending on the dashboard you have opened. We included both in the screenshot for comparison purposes.
Yes, there is an activity window that shows all the running actions, and all this activity is kept as history.
In addition to maintaining the history for later reference, we can see the activities that are being executed in real time. For example, if we apply a corrective action such as rebooting the system, the activities window will show this action as it is happening.
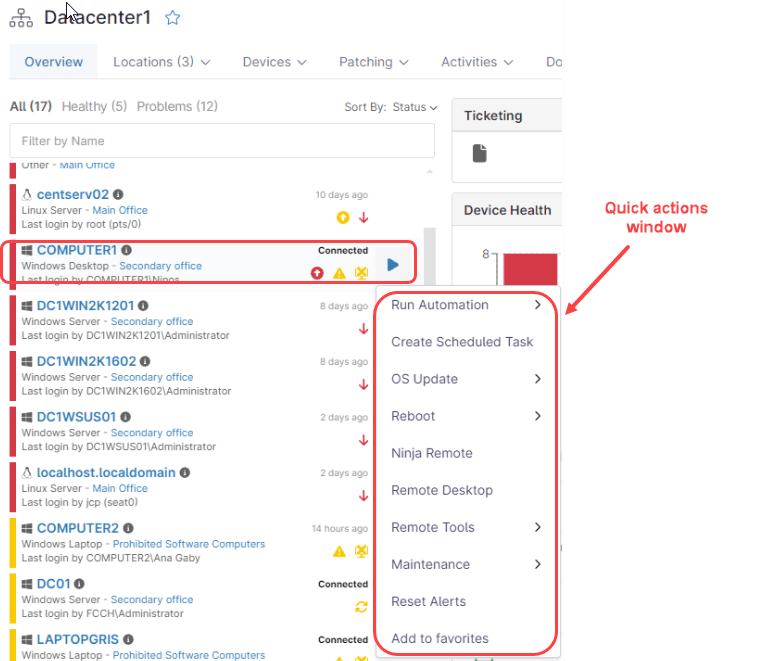
To open the activity window, go to the device panel and click the Toggle Activities button in the top right corner. See the following screenshot for reference:
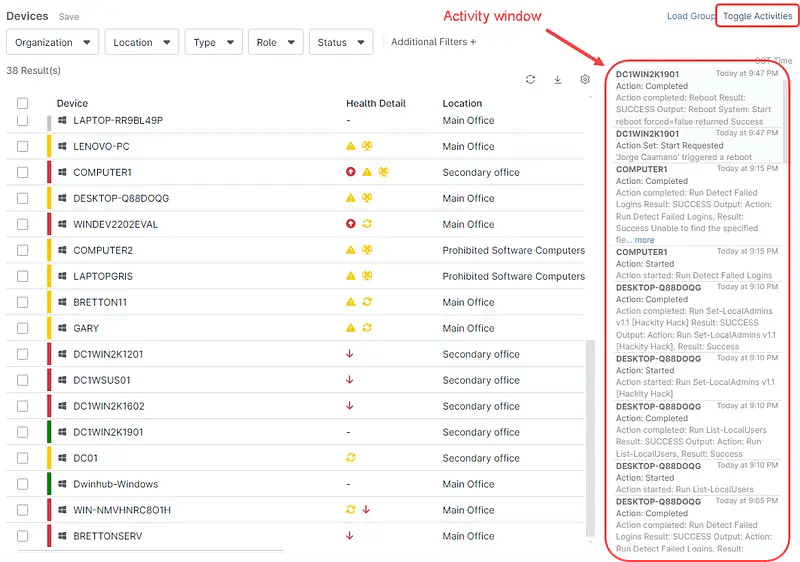
By default, the activity window shows the activity of all devices in the tenant. You can use filters to limit the device view; Once the filter is applied, only activities related to these devices will be displayed. You can also see the activities for a specific device on the page for the device itself.