
Hardware inventory details allows IT departments to keep track of all devices within their organization, including computers, servers, network equipment, and peripherals. This enables efficient asset management, ensuring that resources are allocated appropriately and that there is a clear understanding of what hardware is available. For an MSP (Managed Service Provider), hardware inventory is the cornerstone to provide efficient, cost-effective, and secure IT services to their customers. It gives them the knowledge to proactively manage customer infrastructure, optimize service delivery, and ensure overall customer satisfaction.
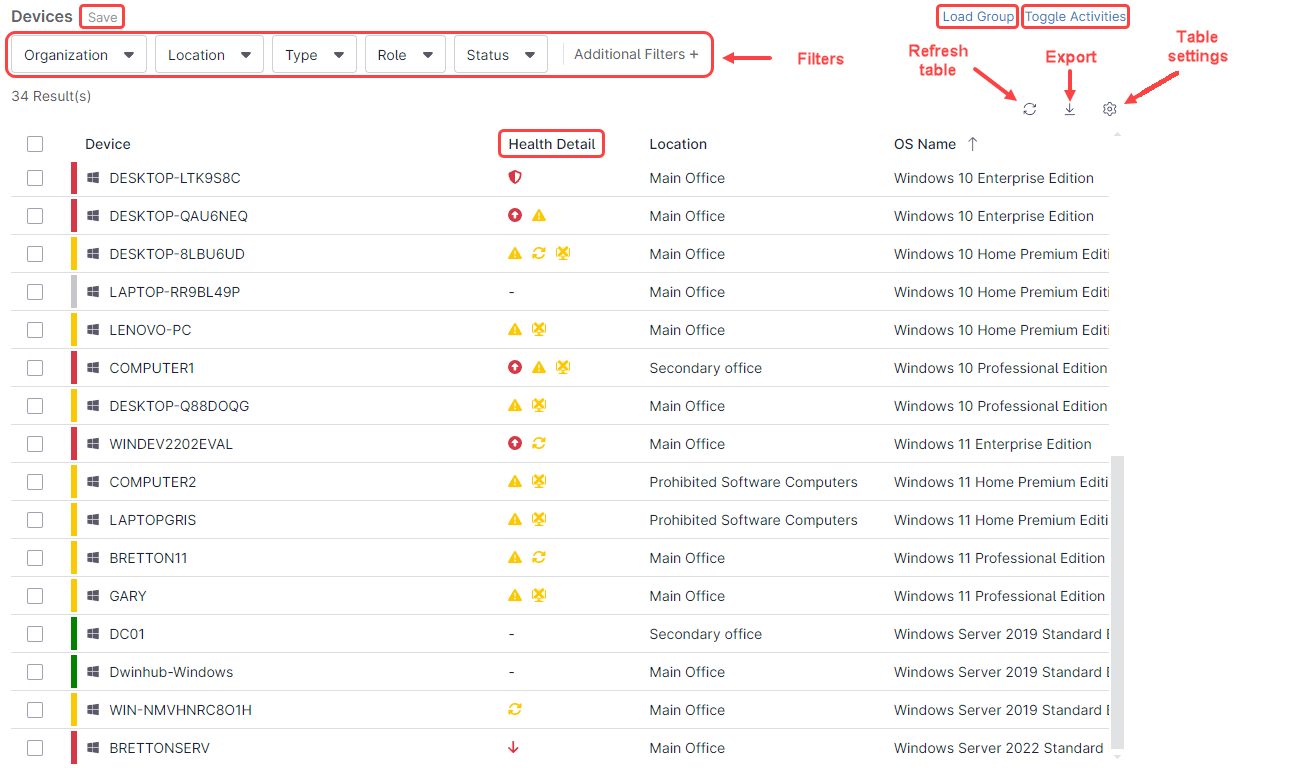
1. Filters. By applying the different filters, the list of devices can be narrowed to show only devices that meet the desired criteria:
- Organization and location filters respectively select only the desired organization and location.
- Type selects the device type, i.e., Linux server, Mac Desktop, Windows Server, Android, etc.
- Role filters according to device role. Each device has a device role assigned.
- Status. Multiple statuses can be selected: Down, Healthy, Unhealthy, Unknown, Up and Needs attention.
- Additional filters: There are fifty-two additional filters that can be selected in this option, Custom Fields, Domain, OS type, DNS server, and device make to name a few.
2. Save. This option is for saving the current list to a device group. Once filters are applied and you have the desired view, this filtered list can be saved to a device group, which can be consulted later. This group is dynamic, which means that whenever loaded, the filters will be applied to show the selected devices that meet the criteria in real time.
3. Refresh table. The table auto-refreshes periodically, but you can also manually force the refresh with this option.
4. Export. This option allows exporting the table. There are options to export the table with the visible columns, with all device details (visible and non-visible columns), and with or without custom fields.
5. Table settings. Allows to add or remove columns to the table, up to twenty fields can be added at the same time. The sorting criteria can also be selected with this option. Device name, Organization, and Policy can be stacked on the first column optionally.
6. Load Group. If you have groups created, this option loads the device group. A drop-down menu will show any available groups.
7. Toggle activities. This option toggles showing or hiding the Activities window or the system log, which shows all actions running in real time. This activity is kept as a history for later reference if necessary. Although the system log records all actions for all devices in general, the Activities window displays only activities for devices that appear in the table after filters are applied.
8. Health Detail. The Health Detail appears as Dashboard Inventory Alerts, which are icons that provide additional information by hovering the mouse over or clicking on them. At the end of this document, there is a link to a document explaining more about Dashboard Inventory Alerts.
When selecting one or more devices using the checkmark on the left side of the devices, one additional option ribbon appears, to take quick actions related to the selected device(s). See the following screenshot for reference:
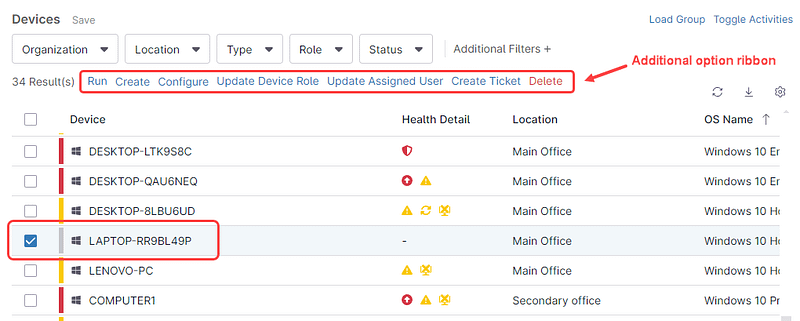
Let´s go through the different quick action menu options, from left to right.
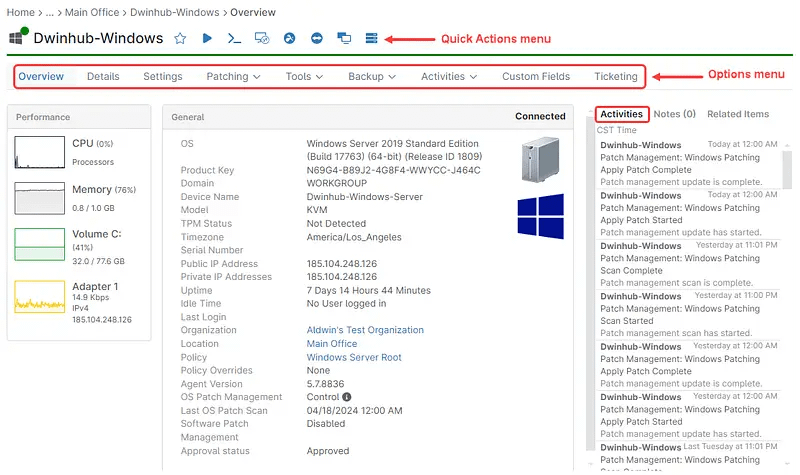
1. Star button. This is for adding this device to the favorites list.
2. Play button. This is for running quick actions related to this device. Options are Run Automation, Create scheduled task, Reboot, OS update and Maintenance. Certain devices like a domain controller may have more options. Less options may appear depending on the device type and health status, for instance the OS update option will not be displayed if the device is down.
3. >_ icon. This option is for opening a command line remote window, like cmd.exe, PowerShell, Shell or Terminal, depending on the device´s OS.
4. Splash icon. This is for requesting a remote session using the Splashtop remote access solution.
5. Double ended arrow icon. This is for requesting a remote session using the TeamViewer remote access solution.
6. Display icon. This is for requesting a remote session using the NinjaOne remote access solution.
7. Stacked disk icon. This is for running backup and restore using the NinjaOne backup solution.
Let’s go through the Options menu, from left to right.
1. Overview. This option shows a general view of the device´s options like OS, serial number, IP address, time zone, etc. It also shows some performance indicators. Nothing can be changed here.
2. Details. This screen shows more detailed performance indicators, memory usage, disk usage, network adapters, open ports, hardware information, Windows services, event log and non-critical events.
3. Settings. This screen shows the device role, assigned user, approval status, display name, organization, location, credentials, policy, policy override (if applicable), approved and rejected pending patches. Most of these fields are editable.
4. Patching. This option is for listing the software inventory and viewing the patching status.
5. Tools. This menu option is for viewing and manipulating the device´s registry, task manager, file browser and service manager.
6. Backup. Here you can see the device´s backup overview and manage the backup options.
7. Activities. With this option you can view the device´s activities, broken down by All, Remote control, Remote tools, and Software added and removed.
8. Custom Fields. This option allows you to view and edit the value of the different custom fields.
9. Ticketing. This is for managing tickets related to this device. It also shows resolution statistics.
On the right side of the screen, the activities window shows the activity related to this device.